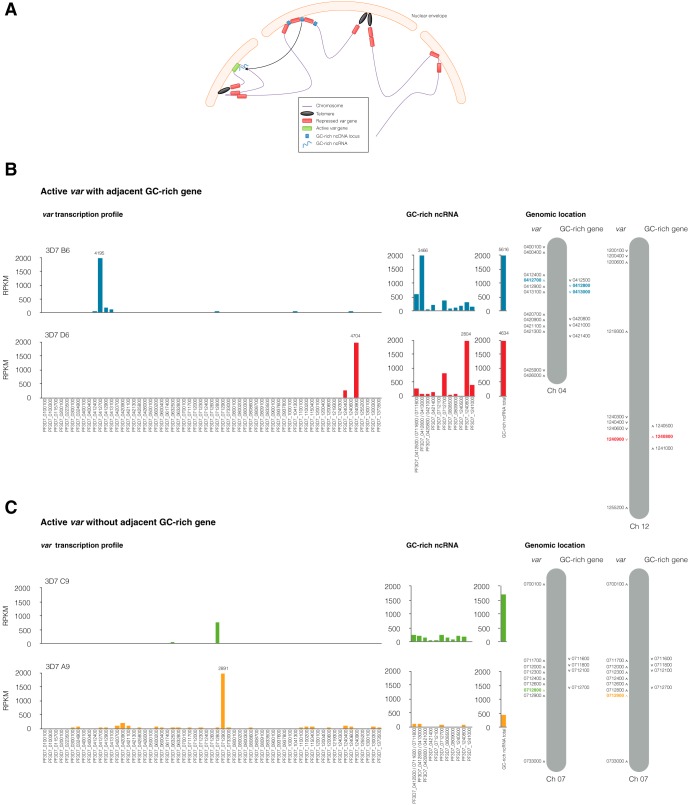
FIG 1.
GC-rich ncRNA and var clonal variation. (A) Schematic model showing repressed var gene perinuclear clustering and active var gene relocation to the active expression site colocalizing with GC-rich ncRNA. ncDNA, noncoding DNA. (B) Transcriptional profile of var genes and GC-rich ncRNA at 12 hpi in WT clones assessed by RNA sequencing. Chromosome schematics (modified from reference 44) highlight the active var genes and GC-rich genes in different clones. Clones 3D7 B6 (blue) and 3D7 D6 (red) have predominant transcription of the GC-rich ncRNA adjacent to their active var locus. (C) Transcriptional profile of var genes and GC-rich ncRNA at 12 hpi in clones 3D7 C9 (green) and 3D7 A9 (yellow), which do not have a GC-rich gene upstream from their respective active central var loci and which have several GC-rich ncRNA transcripts at lower levels. The values are the means of the RPKM from two independent experiments at 12 hpi. The results for further clones are shown in Fig. S1 in the supplemental material.

