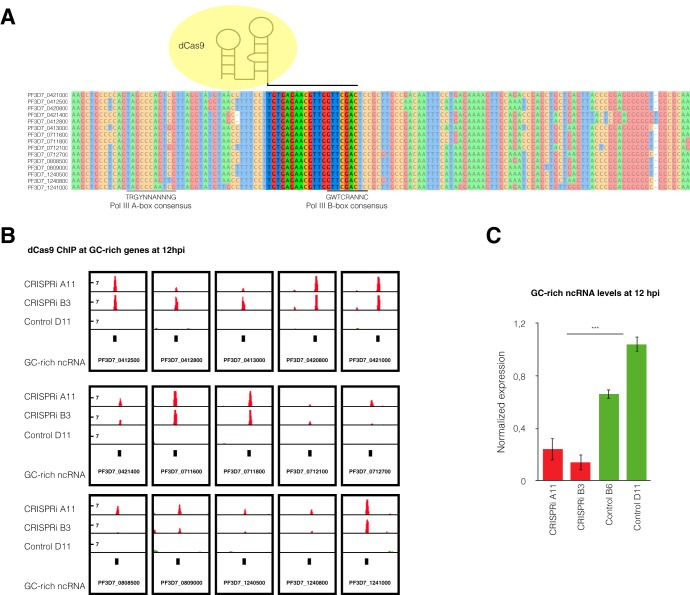
FIG 2.
GC-rich ncRNA knockdown by CRISPR interference. (A) Multiple-sequence alignment of the 15 GC-rich ncRNA members showing the dCas9 target region (not shaded), where the sgRNA binds to the DNA coding strand of all GC-rich genes. The black lines at the bottom show the positions of the polymerase III A- and B-box consensus motifs (45). (B) ChIP sequencing data show the enrichment of dCas9 in the 15 GC-rich gene loci for the CRISPRi line. The logarithmic scale of the likelihood ratio of the fold enrichment over the input level for dCas9 computed with MACS2 software is represented in red for the CRISPRi clones and in green for scrambled control clone D11. The data range for each track is 0 to 14. Data are representative of two independent experiments at 12 hpi. (C) GC-rich ncRNA levels at 12 hpi quantified by RT-qPCR for two GC-rich gene CRISPRi clones (B3 and A11) and two scrambled control clones (control D11 and B6). The levels of expression are normalized to the fructose-bisphosphate aldolase (PF3D7_1444800) transcription levels. The means ± SEMs from three independent experiments are shown. Statistical significance was determined by two-tailed Student’s t test. ***, P < 0.001.

