FIG 3.
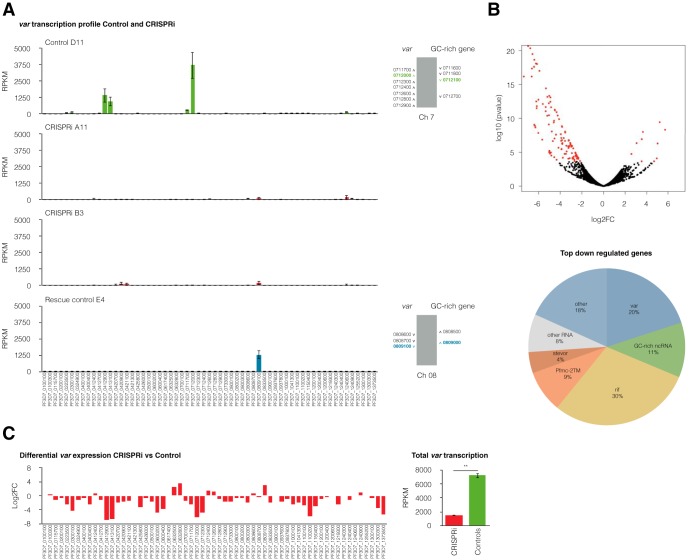
GC-rich ncRNA knockdown leads to the downregulation of var gene expression. (A) (Left) Transcriptional var gene profile at 12 hpi assessed by RNA sequencing for the control gRNA clone D11, two GC-rich ncRNA knockdown clones (CRISPRi B3 and A11), and the rescue control (clone E4). Two control gRNA clones and two rescue control clones were analyzed, but only one representative example for each control is shown. The means ± SEMs from three independent experiments are shown. (Right) Chromosome cluster schematics highlighting active var and GC-rich genes in control clones. (B) (Top) Volcano plot for differential expression between CRISPRi clones and the scrambled control line. Differentially expressed genes with a 0.01 FDR cutoff are represented by red dots. The total number of significantly differentially expressed genes was 125, 92% of which were downregulated and 8% of which were upregulated. (Bottom) Families of top downregulated genes in CRISPRi clones compared to scrambled control clones, significantly differentially expressed with a 0.01 FDR cutoff in three independent replicates. (C) (Left) Differential expression of var genes for CRISPRi clones compared to the scrambled control line shows the downregulation of the entire var gene family. The log of the fold enrichment (log2 fold change [log2FC]) for three replicates of two CRISPRi clones compared to two scrambled control clones is represented. (Right) Mean ± SEM transcriptional levels of the var gene family, as assessed by RNA-seq, for three replicates of two CRISPRi and two scrambled control clones. Statistical significance was determined by two-tailed Student’s t test. **, P < 0.01.

