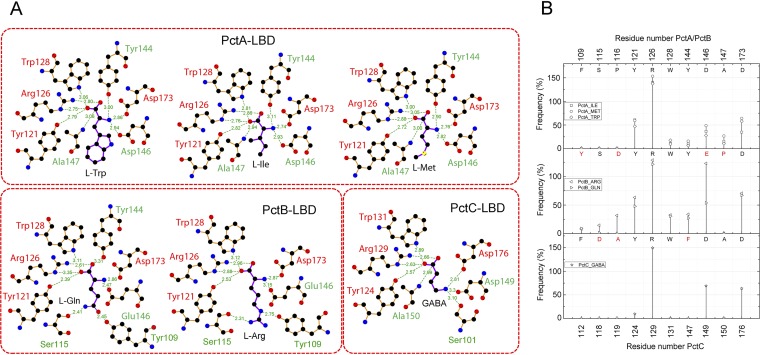
FIG 6.
The hydrogen bonding network established between the three paralogous receptors and bound ligands. (A) The hydrogen bonding network as established by the inspection of the 3D structures. The figure was prepared using the LigPlot software (80). (B) Residues involved in hydrogen bond formation as derived from molecular dynamics simulations. The amino acids for each protein are indicated in the upper part of each panel. The corresponding amino acids in PctB and PctC that are different from PctA are indicated in red.

