FIG 3.
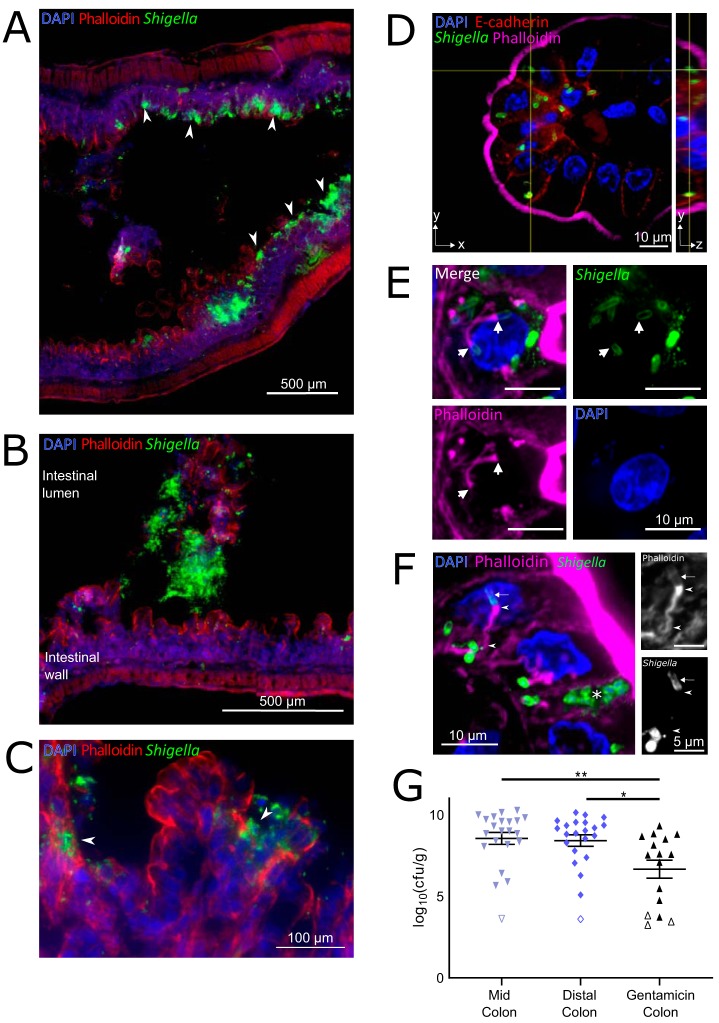
Localization of S. flexneri in the colons of infected infant rabbits. (A to F) Immunofluorescence micrographs of S. flexneri in colonic tissue of infected rabbits 36 hpi. (A) S. flexneri bacteria were found in large numbers in epithelial foci (white arrowheads point to selected foci). (B) S. flexneri bacteria in the lumen of the colon. The intestinal lumen and intestinal wall are labeled. (C) Arrowheads show infection foci where multiple neighboring cells contain intracellular S. flexneri. (D) Immunofluorescence z-stack micrograph of S. flexneri within colonic epithelial cells. The left (square) panel shows the xy plane at a single z position, indicated by the horizontal axis of the cross-hairs in the yz projection. The right (rectangular) panel shows yz projection along the plane indicated by the vertical axis of the cross-hairs in the xy plane. (E) Immunofluorescence micrograph of S. flexneri associated with actin tails within colonic epithelial cells. White arrows point to poles of S. flexneri bacterial cells from which the actin tail is formed. Bars, 10 μm. (F) Immunofluorescence micrograph of S. flexneri forming protrusions during cell-to-cell spread between colonic epithelial cells. The white asterisk marks a likely primary infected cell. Panels show zoomed region of phalloidin or anti-Shigella channels. Arrow points to actin surrounding the bacterial cell in a protrusion, arrowheads indicate the actin tail and actin cytoskeleton inside the protrusion at the pole of the bacterial cell and at the base of the protrusion. DAPI (blue), FITC-conjugated anti-Shigella antibody (green), phalloidin-Alexa Fluor 568 (red in panels A and C or magenta in panels D to F), and when present, anti-E-cadherin (red in panel D). (G) Bacterial burden of S. flexneri WT strain in the indicated intestinal sections 36 hpi. Each symbol represents the measurement from one rabbit. Data are plotted as log-transformed CFU (CFU per gram of tissue) (means and standard error of the mean values are superimposed). Open symbols represent the limit of detection of the assay and are shown for animals where no CFU were recovered. Statistical significance was determined with a Kruskal-Wallis test with Dunn’s multiple-comparison posttest. *, P < 0.05; **, P < 0.01.

