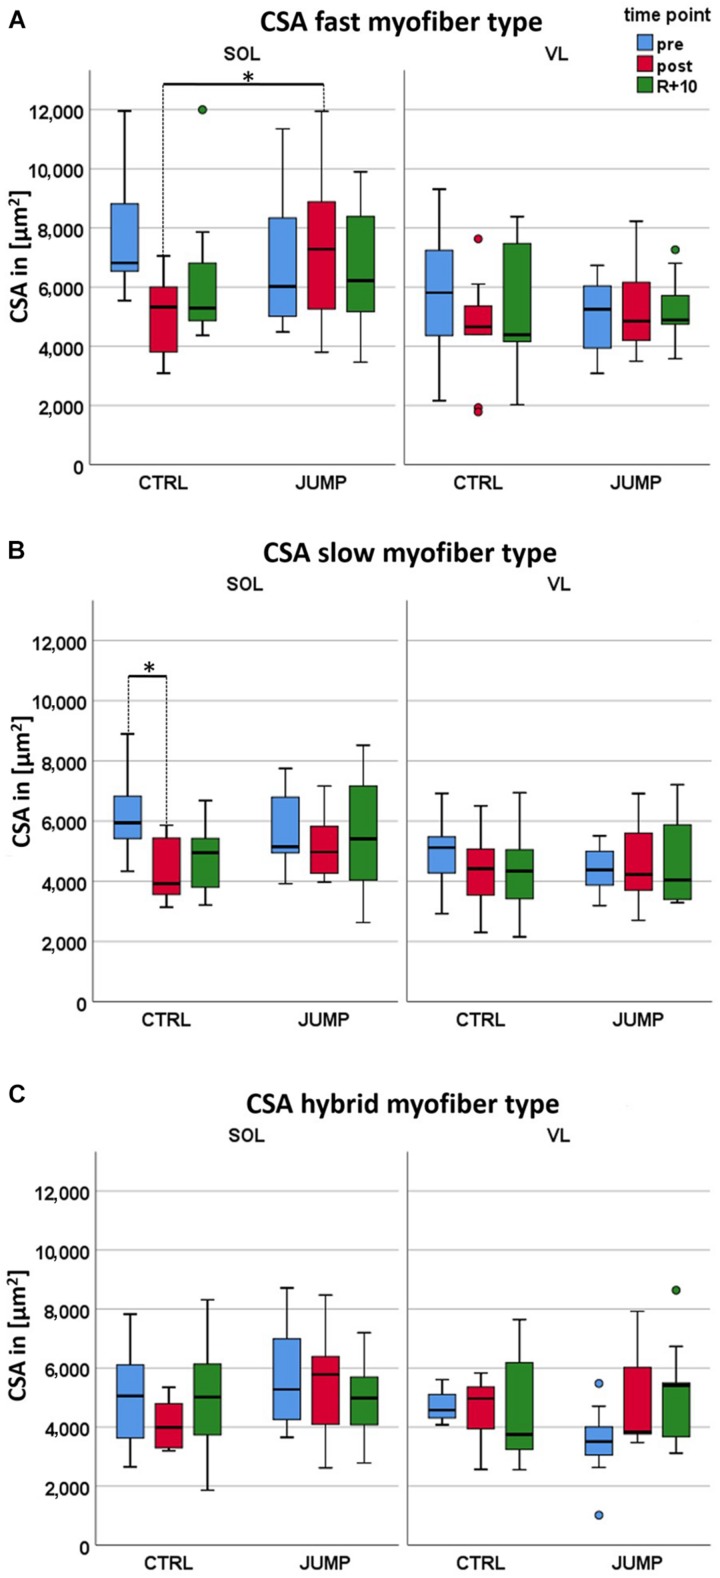
FIGURE 1.
Effect of 60 days RSL study bed rest on soleus (SOL) and vastus lateralis (VL) myofiber cross-sectional area (CSA) with and without JUMP training as countermeasure at three different time points (pre/post/recovery). (A) Box plots showing fast myofiber II mean CSA (μm2) of control (CTRL) (SOL n = 10, VL n = 9) and JUMP (SOL n = 12, VL n = 12). (B) Box plots showing slow myofiber I mean CSA (μm2) of CTRL (SOL n = 10, VL n = 9) and JUMP (SOL n = 12, VL n = 12). CSA values denote pre bed rest before (pre, blue), at end (post, red), and at 10 days of recovery after bed rest (R + 10, green). (C) Box plots showing fast (blue) and slow MyHCs (red) vs. hybrids (expressing both MyHCs, green) mean CSA (μm2) of CTRL (SOL n = 6, VL n = 4) and JUMP (SOL n = 11, VL n = 8). ∗Significance p < 0.0001.

