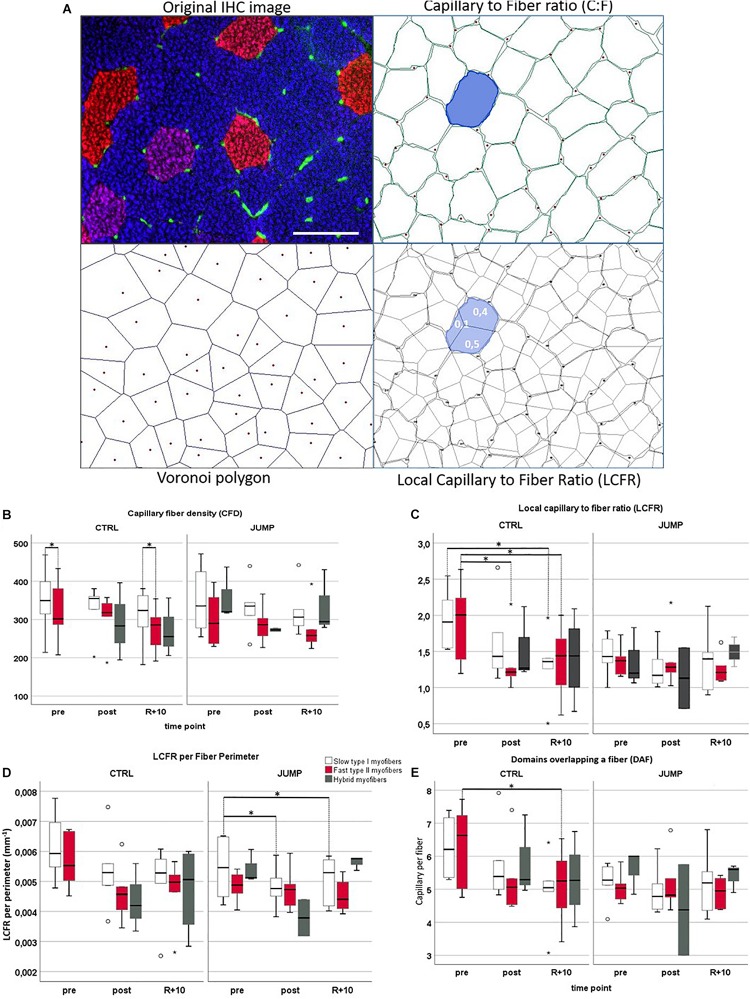
FIGURE 3.
Capillarization in vastus lateralis (VL) muscle from RSL study groups at three different time points (pre/post/R + 10). (A) Representative VL cryosection [head-down tilt (HDT) + 58, upper left] immunostained with slow MyHC-I (red), fast MyHC-II (blue), and platelet endothelial cell adhesion molecule 1 (PECAM-1, green), identifying capillary structures. Upper right shows automatically drawn myofiber borders (green) and capillaries (red dots) using BTablet Software (BaLoH). Lower left shows calculated Voronoi polygons (VP, also referred to as capillary domains; gray lines) representing the area of tissue closer to a given capillary (red dots) than neighboring capillaries. Lower right shows overlap of VP with myofiber borders, local capillary-to-fiber ratio (LCFR) illustrated in blue with fraction size supplied through different capillaries indicated as numbers (0.1, 0.4). Scale bar (top left): 100 μm. (B–E) Box plots for different capillarity parameters: (B) capillary fiber density (CFD), (C) local capillary-to-fiber ratio (LCFR), (D) LCFR per fiber perimeter, and (E) domains overlapping a fiber (DAF) in different myofibers (slow = no color/fast = red/hybrids = gray), groups (CTLR vs. JUMP), and time points (pre/post/R + 10). ∗Significant differences p < 0.05; non-parametric Friedman with post hoc Dunn-Bonferroni correction, box plots (means) with median ± 2 SE; small circles (o) = statistical outliers.

