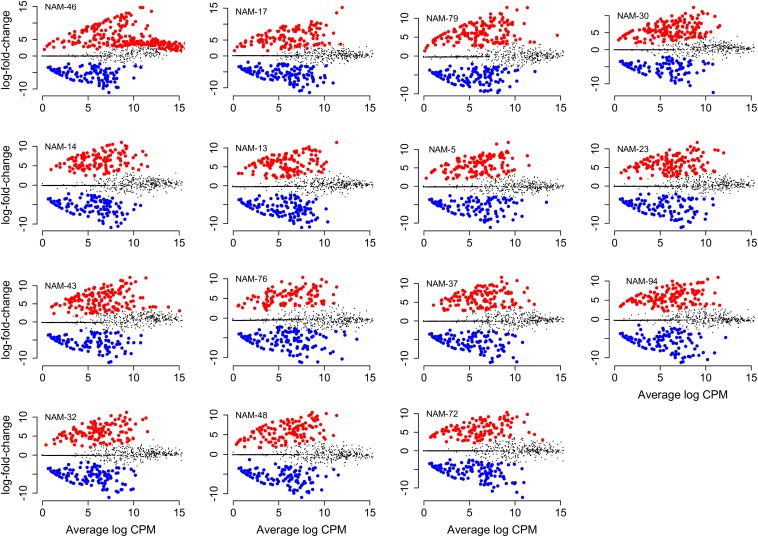
FIGURE 3.
Differentially abundant bacterial genera compared with the reference genotype (NAM-0). Change in absolute abundance in B. napus genotypes (log fold change) is shown against average abundance in count per million (CPM). Red dot indicates significantly differentially more and blue less abundant taxa (FDR < 0.01). The non-significant genera are indicated in gray. Names of B. napus genotypes are indicated at the top left corner of individual plots. Plots are arranged left to right from genotype with the highest to the lowest number of differentially abundant genera compared with NAM-0.

