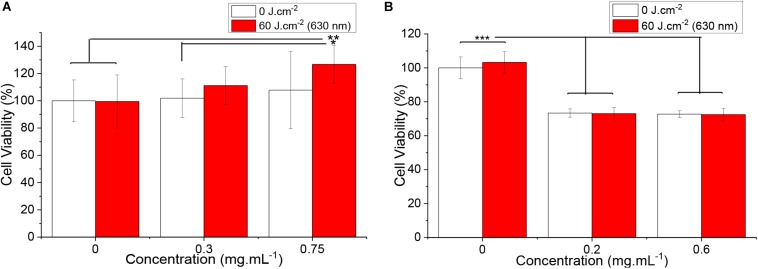
FIGURE 10.
Human dermal fibroblasts viability when exposed to (A) GO and (B) nGO for 45 min and irradiated with 630 nm (60 J cm–2). White bars represent the groups that remained protected from light, while groups exposed to the light source are displayed in red. The ∗, ∗∗ and ∗∗∗ symbol the bars indicate statistically significant difference between the indicated groups according to Tuckey’s multiple comparisons (p ≤ 0.05, p ≤ 0.01, and p ≤ 0.001, respectively).

