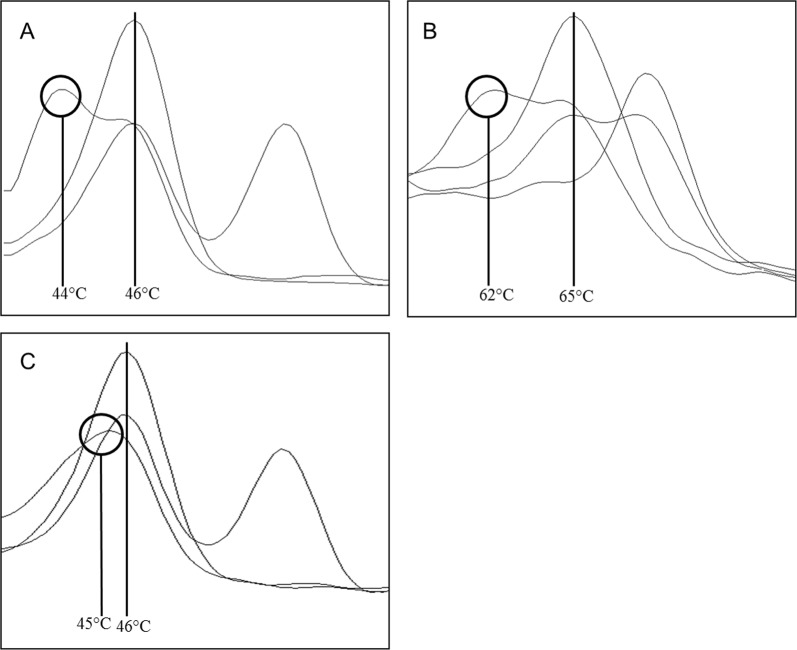
Fig. 3.
Shift of melting peaks. a Melting analysis to detect rs786204501 (c.18_21del GACT) in the channel 498–640 with a heterozygous sample showing a lowered melting peak (44 °C) next to the wildtype peak (46 °C). Sequencing identified the c.12T>C variant, described as non-pathogenic. The two other samples showed a wildtype and a heterozygous melting peak. b Melting analysis to detect rs786204420 (c.926dupG) in the channel 465–510 with a heterozygous sample showing a lowered melting peak (62 °C) next to the wildtype (65 °C). Sequencing identified the c.922G>A variant, described as disease-causing in HGMD® database. One sample is wildtype for the tested variant, with a melting point at 65 °C, one sample is homozygous for the c.926dupG giving a melting peak at 72 °C and one sample is heterozygous for this variant. c Melting analysis to detect rs786204501 (c.18_21del GACT) in the channel 498–640 with a heterozygous sample showing a lower and more wide melting peak (45 °C) relative to the wildtype peak (46 °C). Sequencing identified the c.29T>C variant, described as disease-causing in HGMD® database. The two other samples showed a wildtype and a heterozygous melting peak

