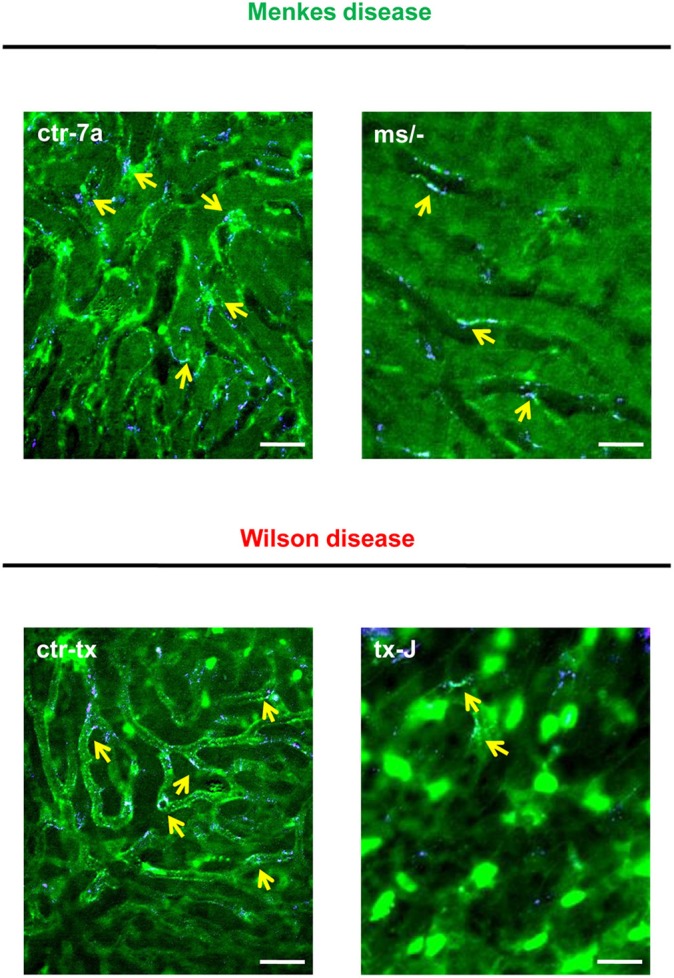
Figure 2.

Detection of NET components in the liver vasculature of endotoxemic Wilson (tx-J) and Menkes (ms/−) disease mice and their respective controls (ctr-tx and ctr-7a). On images, autofluorescent hepatocytes (dim green) as well as Sytox green+ extracellular DNA (bright green) and NE signal (violet) are seen. Overlay of extDNA and NE is indicative of NETs (yellow arrows). The scale bar indicates 50 μm.
