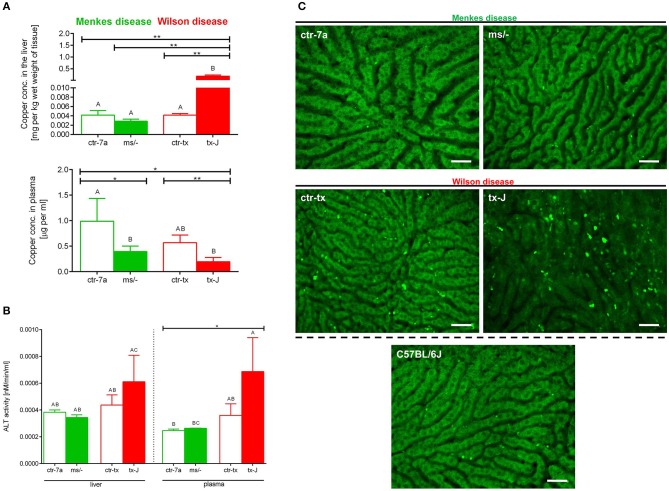
Figure 7.
Liver and plasma copper accumulation (A) and alanine transaminase (ALT; B) levels estimated in mice with Wilson (tx-J) and Menkes (ms/−) diseases and their respective controls (ctr-tx and ctr-7a). Asterisks indicate significant differences using unpaired two-tailed Student's t test (*P ≤ 0.05, **P ≤ 0.01) and one-way ANOVA (post hoc Bonferroni) test (different letters indicate statistically significant differences between groups). Condition of hepatocytes, visibility of sinusoids, and deposition of autofluorescent aggregates is shown on representative images of livers in (C); images of mice with Wilson and Menkes diseases are shown along with their controls and C57Bl/6J mice. No additional staining was performed, and only autofluorescent hepatocytes (green) were recorded in the GFP channel. Between the hepatocytes, sinusoids (black ducts) can be observed. The scale bar indicates 50 μm.

