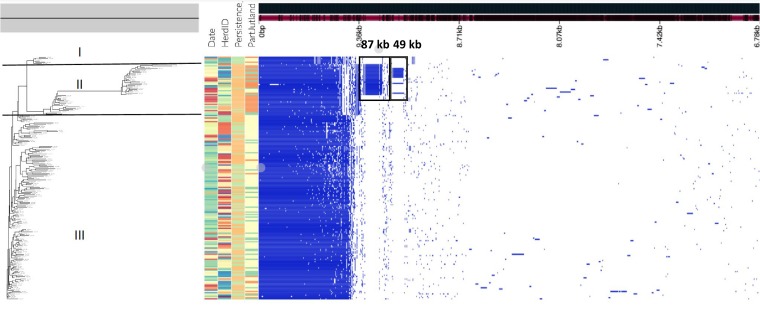
FIG 2.
Pangenome of 197 S. Dublin isolates from 58 cattle herds sampled in Denmark from 1996 to 2016. The hierarchic tree was generated based on gene presence/absence in the genomes. I to III indicate the three clades of S. Dublin as defined by core genome SNP phylogeny. The top row represents the calculated pangenome of S. Dublin, and blue and white squares represent the presence and absence, respectively, of genes in each S. Dublin genome. The black squares indicate CDS blocks representing the 49- and 87-kb plasmids.

