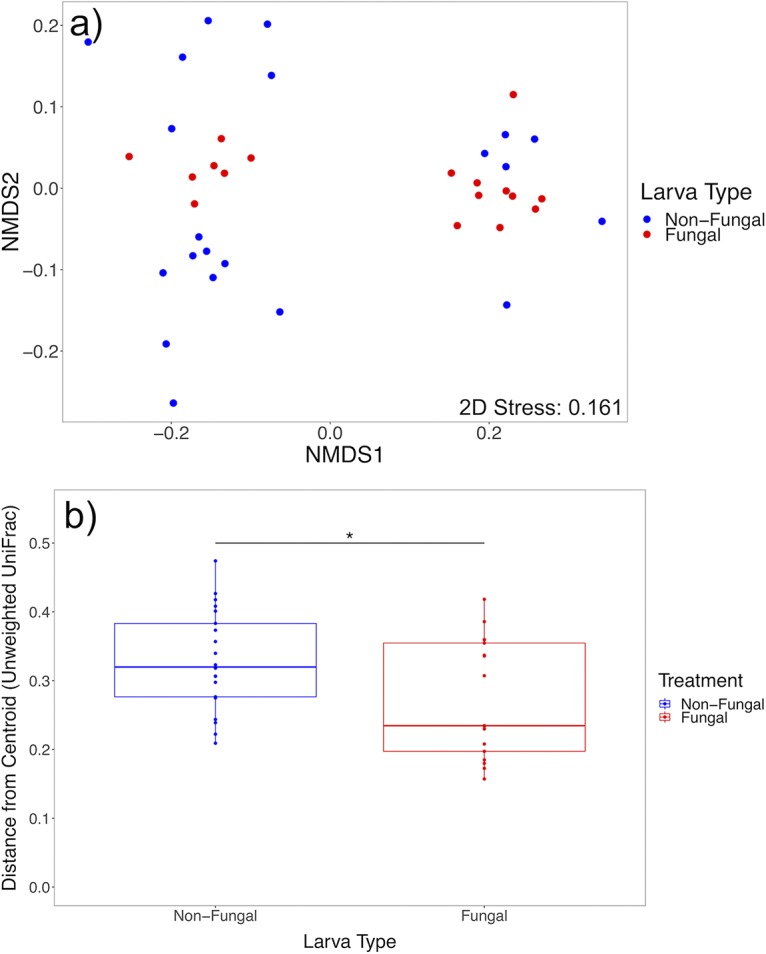
FIG 3.

Analyses of unweighted UniFrac distance for larval microbiomes across treatments. (a) Nonmetric multidimensional scaling plot based on unweighted UniFrac distance. (b) Box plots of within-group variation of unweighted UniFrac distance, represented by the distance of each sample’s value from the group’s centroid value, show that nonfungal larvae have higher within-group variation for the metric (n = 38). Upper and lower limits of boxes represent quartiles around the mean, and horizontal lines within boxes represent median values. Significant differences of within-group variation across treatments were calculated with a permutational statistical test for the homogeneity of group dispersions (*, P < 0.05).
