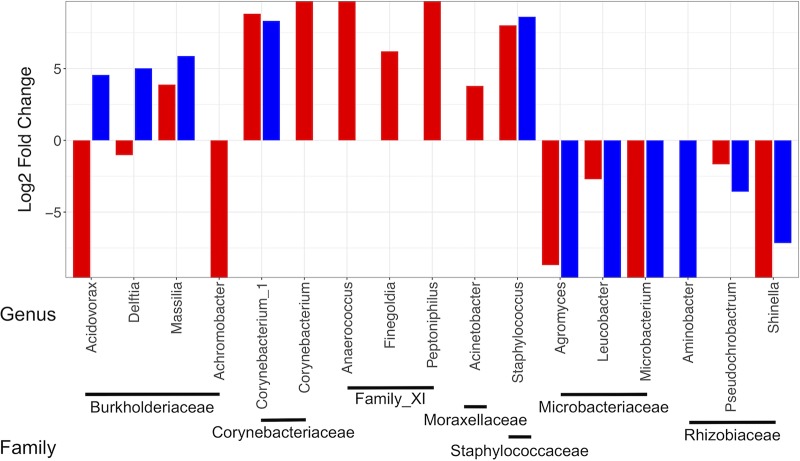
FIG 6.
Log2(fold change) values for genera from families identified to significantly differ in mean relative abundances across developmental stages of nonfungal (blue) and fungal (red) mosquitoes. Only genera present at greater than 1% relative abundances in either developmental stage within each treatment group are shown. Positive values indicate an increase while negative values indicate a decrease in the abundance of each genus in adults relative to levels in larvae.

