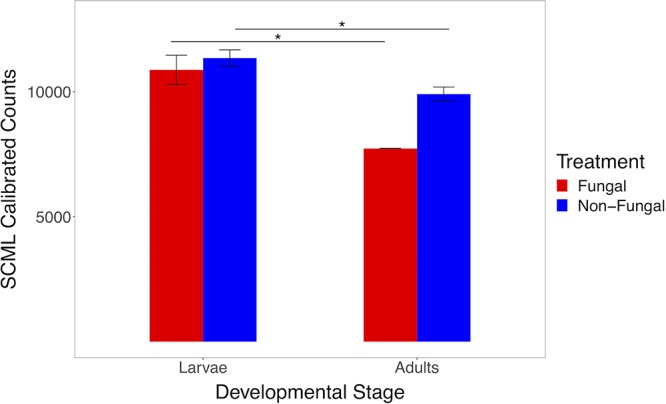
FIG 8.

Bar plots of mean read counts calibrated using spike-in calibration to microbial load (SCML) across developmental stages for each treatment group. Comparative analyses show larger bacterial loads in larvae than in adults for both groups. Error bars indicate standard error (n = 42). Statistical differences were calculated with a linear mixed model (*, P < 0.05).
