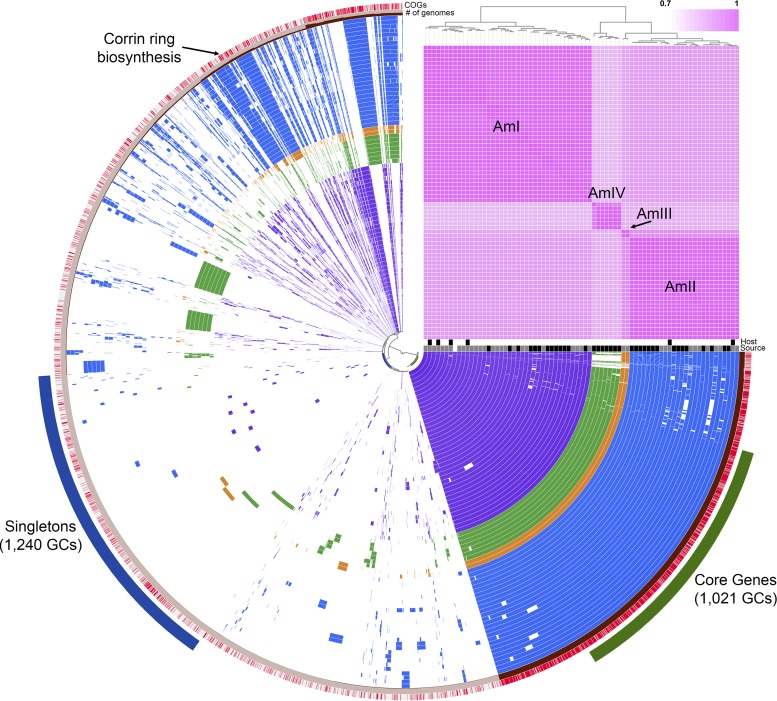
FIG 1.
Pangenome of 75 Akkermansia genomes generated using anvi’o (17, 18). Each concentric circle represents a bacterial genome, with purple circles belonging to the AmI phylogroup, blue to AmII, orange to AmIII, and green to AmIV. Blank areas in each circle indicate the absence of a particular GC in that genome. A total of 6,557 GCs were observed across all genomes. Genomes are ordered by ANI, as depicted by the pink heatmap in the upper right. Host organisms are indicated below the heatmap, in white (human) or black (mouse) boxes. Similarly, genome sources are indicated in white (12), gray (14), and black (this work) boxes. The outermost ring is colored according to the presence (red) or absence (gray) of functional COG annotations. The next ring indicates the number of genomes in which that particular GC was observed. Singleton (blue) and core (green) genes are indicated outside the concentric circles. Corrin ring biosynthesis genes are indicated in the AmII (blue) and AmIII (orange) genomes.

