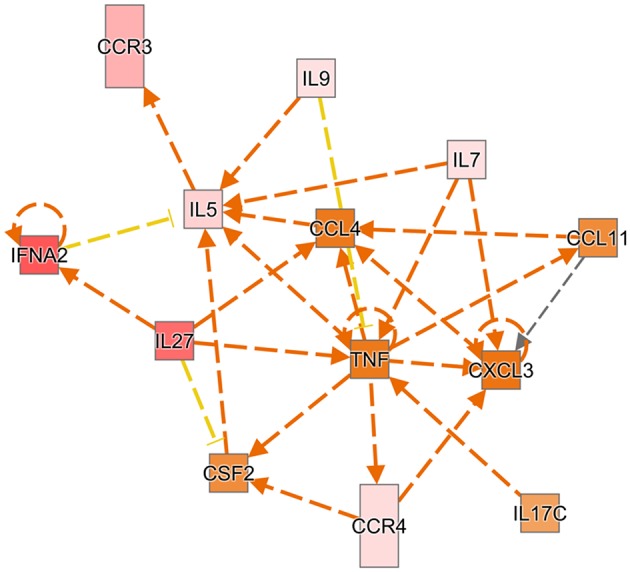
Figure 1.

Ingenuity pathway analysis predicts the upstream and downstream effects of activation or inhibition of the 13 genes from the distal blood in a network. A red box indicates the gene is more extreme in the dataset, while different shades of pink mean the gene is measured less in the dataset. An orange box indicates the gene has more confidence in predicted activation. Directional orange arrows indicate which gene leads to activation of another gene. Yellow arrows indicate the findings are inconsistent with downstream gene.
