Figure 3.

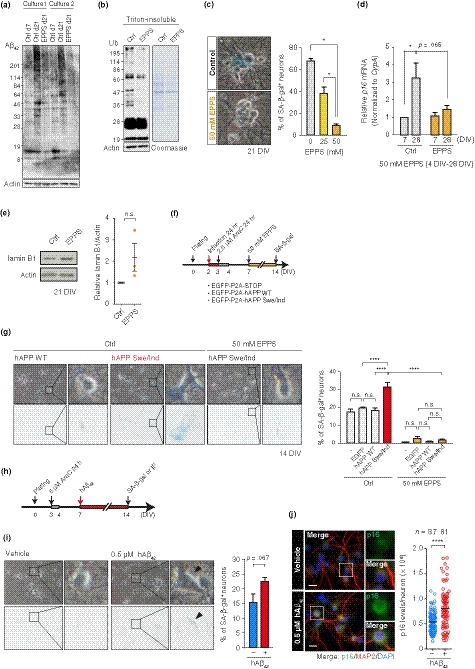
AD‐related proteotoxicity induced senescence features in PHNs. (a) Immunoblotting of Aβ42 in total cell extracts from two independent cultures of PHNs that were continuously treated with vehicle (control/Ctrl) or 50 mM EPPS from 4 DIV. (b) Western blot and Coomassie staining of the insoluble fraction from 21 DIV PHNs treated as in (a). Soluble actin is shown as a loading control. (c) SA‐β‐gal activity in 21 DIV PHNs treated as in (a). (d) Quantification of p16 mRNA by RT–qPCR. (e) Immunoblotting of lamin B1 in Ctrl or EPPS‐treated PHNs, as in (a). (f) Timeline of the experiments in (g). (g) SA‐β‐gal activity in 14 DIV PHNs expressing EGFP, hAPP WT, or hAPP Swe/Ind with or without 50 mM EPPS. (h) Timeline of prolonged exposure to toxic Aβ peptides (0.5 μM) in (i) and (j). (i) SA‐β‐gal activity in 14 DIV PHNs treated as in (h). (j) p16 and MAP2 immunofluorescence performed on PHNs at 14 DIV. Scatter plots showing a representative quantification of p16 levels in MAP2+ neurons, with median. Scale bar, 20 μm. The mean ± SEM of at least three independent experiments is presented in panels (c), (d), (e), (g), and (i). One‐way ANOVA for (c); two‐way ANOVA for (d) and (g); unpaired two‐tailed t test for (e) and (i); Mann–Whitney U test for (j) (*p ≤ .05; ****p < .0001). n.s., not significant
