Figure 5.

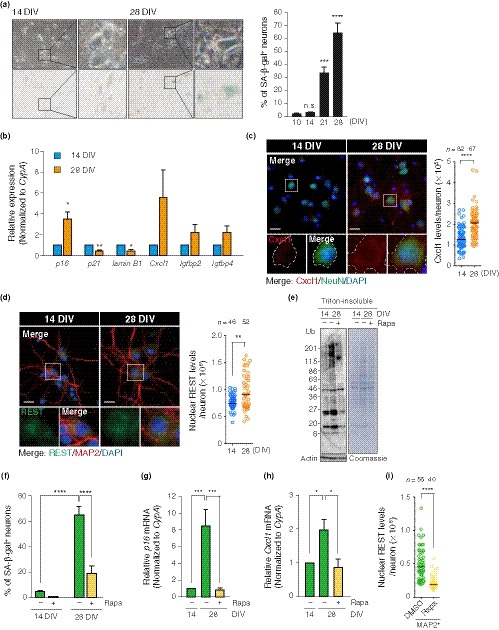
Rapamycin counteracts senescence phenotypes in PCNs. (a) Time‐course analysis of SA‐β‐gal activity of PCNs. (b) Relative changes in expression levels of senescence marker genes measured by RT–qPCR. (c) Immunostaining of Cxcl1 in NeuN+ PCNs. A representative quantification of Cxcl1 is shown, with the median. A white‐bordered neuronal soma in each enlarged view shows distinct levels of Cxcl1 protein at 14 and 28 DIV. Scale bar, 20 μm. (d) Immunostaining of nuclear accumulation of REST in MAP2+ PCNs. A representative quantification of nuclear REST levels is shown, with the median. Scale bar, 20 μm. (e) Immunoblotting of DMSO or 100 nM rapamycin (Rapa)‐treated PCNs at 14 or 28 DIV with soluble actin as loading control. (f) SA‐β‐gal staining with PCNs that were continuously exposed to DMSO or Rapa from 4 DIV until analysis, as indicated in (e). (g), (h) Expression levels of p16 and Cxcl1 mRNA in DMSO and Rapa‐treated PCNs were determined by RT–qPCR. (i) A representative quantification of levels of nuclear REST in MAP2+ PCNs at 28 DIV chronically treated with DMSO or Rapa is shown, with the median. The means ± SEM of at least three independent experiments are presented in (a), (b), (f), (g), and (h). One‐way ANOVA in (a), (g), and (h); unpaired two‐tailed t test for (b); two‐way ANOVA for (f); Mann–Whitney U test for (c), (d), and (i) (*p < .05; **p < .01; ***p ≤ .002; ****p < .0001). n.s., not significant
