
Figure 5.
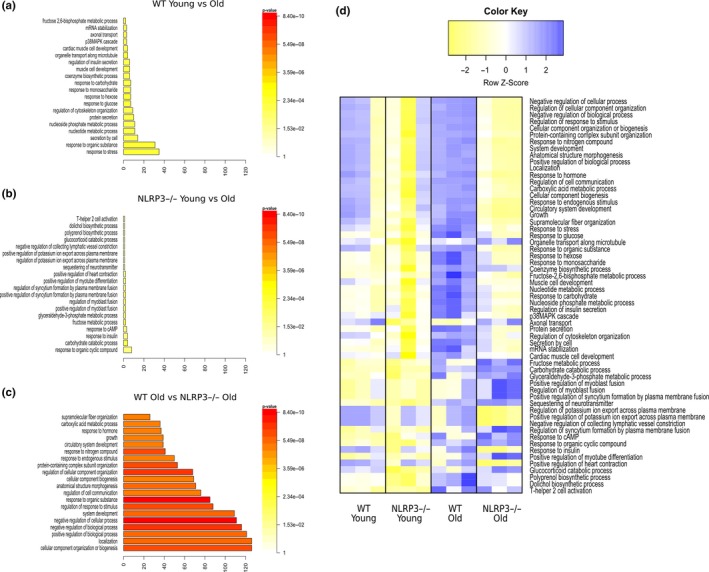
Transcriptional changes in heart from Young and old WT and NLRP3 −/− mice. Gene Ontology enrichment analysis in “Biological Process” in WT young vs. old mice (a), NLRP3 −/− Young vs. old mice (b), and WT old vs. NLRP3 −/− old mice (c). (d) Heatmap clustering of enrichment (z‐scores) of the functions defined by the DAVID in set of coding genes differentially expressed between WT old vs. NLRP3 −/− old mice (n = 3 per treatment)