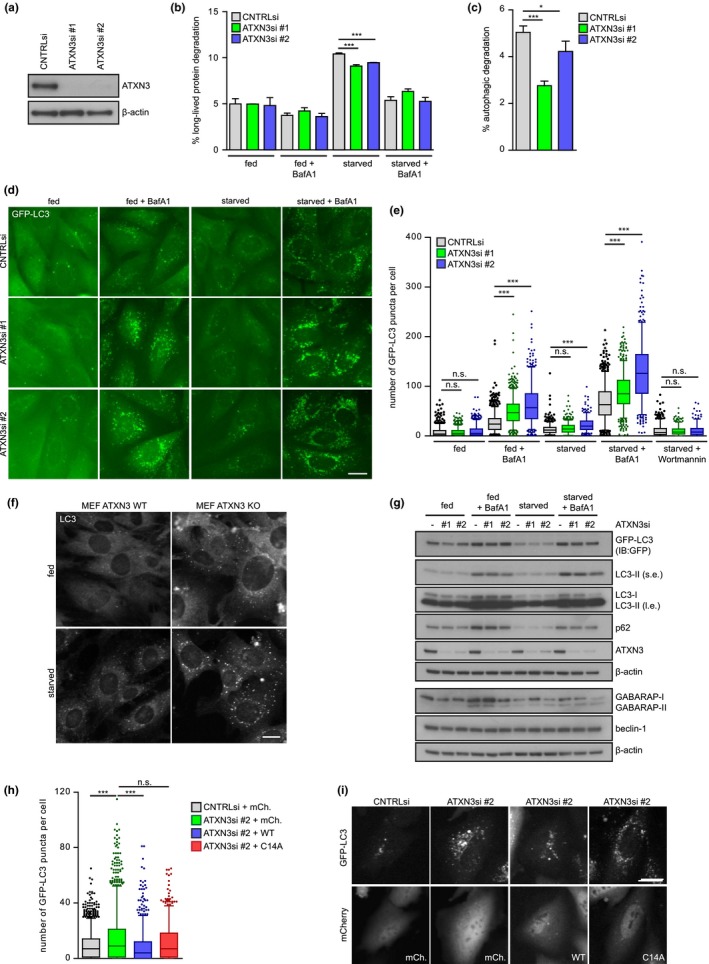
Figure 2.

ATXN3 depletion increases the number of autophagosomes and impairs degradation of long‐lived proteins. (a) Knockdown efficiency of two different siRNAs targeting ATXN3 (ATXN3si #1, ATXN3si #2) in HOS GFP‐LC3 cells. (b) Long‐lived protein degradation assay in U2OS cells depleted of ATXN3 and treated as indicated. Percentage of long‐lived protein degradation was quantified. Data are presented as mean ± SD of three independent experiments, each performed in technical duplicates. *p ≤ .05, **p ≤ .01, ***p ≤ .001 (one‐way ANOVA). (c) Percentage of long‐lived protein degradation by autophagy was quantified as the bafilomycin A1‐sensitive fraction of degradation during starvation in (b); *p ≤ .05, **p ≤ .01, ***p ≤ .001 (one‐way ANOVA). (d) Representative micrographs of HOS GFP‐LC3 cells depleted of ATXN3 using two different siRNAs (ATXN3si #1, ATXN3si #2). Cells were treated as indicated and imaged live using an automated widefield microscope. Scale bar: 20 μm. (e) Quantification of GFP‐LC3 puncta per cell upon ATXN3 depletion in HOS GFP‐LC3 cells. Data are presented as box plot with median and 5–95 percentile of at least two independent experiments, n ≥ 360, *p ≤ .05, **p ≤ .01, ***p ≤ .001 (Kruskal–Wallis test). (f) Representative micrographs of endogenous LC3B in wild‐type or ATXN3 knockout (KO) mouse embryonic fibroblasts (MEFs) treated as indicated for 4 hr. Scale bar: 20 μm (g) Western blot analysis of autophagy proteins in HOS GFP‐LC3 upon siRNA‐mediated depletion of ATXN3. Cells were treated as indicated for 4 hr and analyzed by immunoblotting using the indicated antibodies (s.e.: short exposure; l.e.: long exposure). (h) Quantification of GFP‐LC3 puncta per cell upon ATXN3 depletion using ATXN3si #2 and transient overexpression of mCherry‐C1 (mCh.), mCherry‐ATXN3 WT (WT), or mCherry‐ATXN3 C14A (C14A) in HOS GFP‐LC3 cells. Cells were starved for 4 hr in the presence of 100 nM bafilomycin A1. Data are presented as box plot with median and 5–95 percentile of four independent experiments, n ≥ 700, *p ≤ .05, **p ≤ .01, ***p ≤ .001 (Kruskal–Wallis test). (i) Representative micrographs of HOS GFP‐LC3 cells depleted of ATXN3 using ATXN3si #2 and transfected with mCherry‐C1 (mCh.), mCherry‐ATXN3 WT (WT), or mCherry‐ATXN3 C14A (C14A). Cells were imaged live using an automated widefield microscope. Intensities in micrographs showing mCherry signal of WT and C14A samples were rescaled. Scale bar: 20 μm
