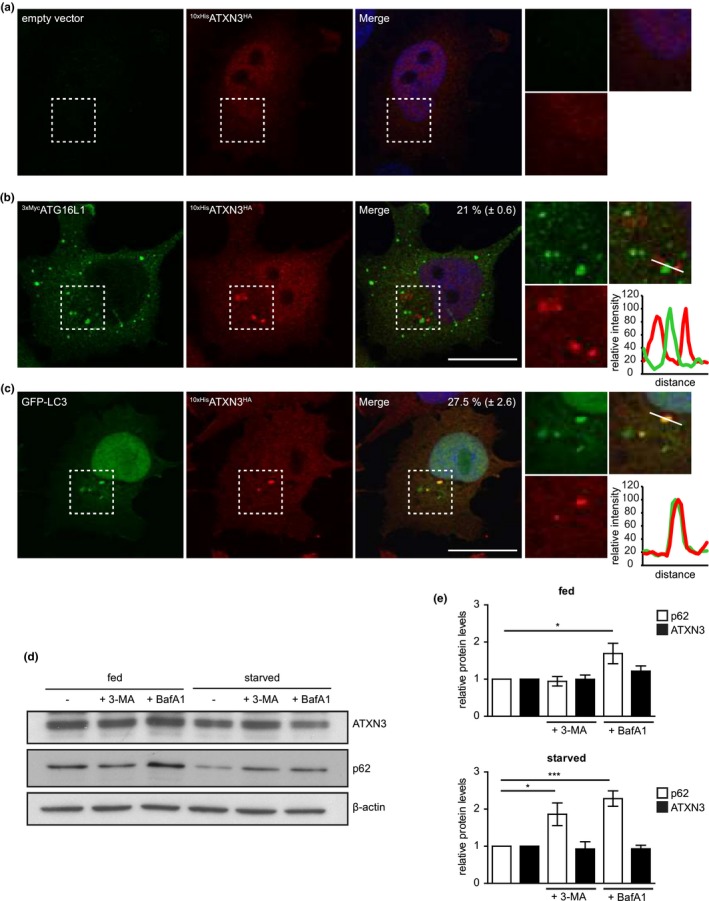
Figure 6.

ATXN3 localizes at autophagosomes. (a, b) HeLa cells expressing dox‐inducible 10xHisATXN3HA were transfected with empty vector (a) or 3xMycATG16L1 (b) and 10xHisATXN3HA expression induced for 24 hr. Cells were starved for 2 hr, fixed, and immunolabeled using antibodies against HA‐tag and Myc‐tag. Line scan at site of 3xMycATG16L1 accumulation to visualize the spatial distribution of the proteins. The percentage of 3xMycATG16L1 puncta that were associated with ATXN3 was quantified. Data are presented as mean ± SEM of four independent experiments. (c) HeLa cells expressing dox‐inducible 10xHisATXN3HA were transfected with GFP‐LC3 and 10xHisATXN3HA expression induced for 24 hr. Cells were starved for 2 hr, fixed, and immunolabeled using antibodies against HA. Line scan at site of GFP‐LC3 accumulation to visualize the spatial distribution of the proteins. The percentage of GFP‐LC3 puncta that co‐localized with ATXN3 was quantified. Data are presented as mean ± SEM of three independent experiments (d) HeLa cells were treated as indicated for 4 hr and cell lysates analyzed by immunoblotting using the indicated antibodies. (e) Band intensities were quantified and normalized to β‐actin and to the respective control treatment. Data are presented as mean ± SD of three independent experiments. *p ≤ .05, **p ≤ .01, ***p ≤ .001 (one‐way ANOVA)
