
Figure 3.
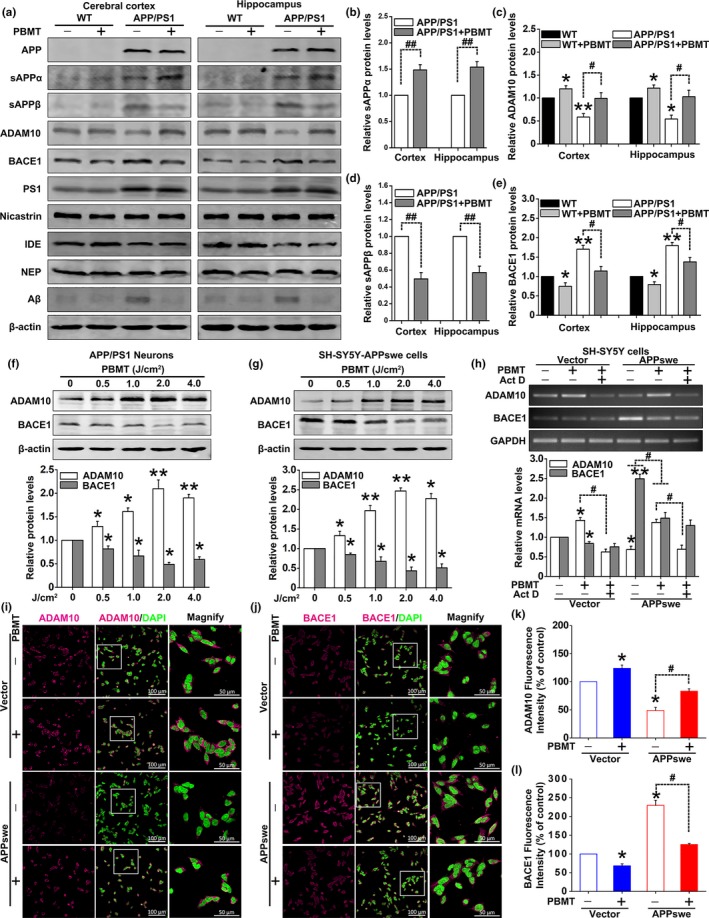
Effects of PBMT on APP processing in vivo and in vitro. (a) Representative Western blot bands of Aβ, APP, sAPPα, sAPPβ, ADAM10, BACE1, PS1, nicastrin, IDE, and NEP in the cerebral cortex and hippocampus of WT and APP/PS1 mice (n = 5), whether or not with PBMT. (b–e) Densitometric quantification of exogenous human sAPPα (b) and sAPPβ (d), endogenous mouse ADAM10 (c) and BACE1 (e) expressions after indicated treatments. (f, g) Representative Western blot assays for detecting the dose‐dependent effects of PBMT on endogenous ADAM10 and BACE1 expressions in APP/PS1 neurons (f) and SH‐SY5Y‐APPswe cells (g). (h) ADAM10 and BACE1 mRNA levels were detected by PCR stimulated with PBMT in the presence of Act D (10 μM) in SH‐SY5Y cells. (i, j) Representative immunofluorescent images of ADAM10 (i) and BACE1 (j) in SH‐SY5Y cells. Staining with DAPI to visualize nucleus. (k, l) The fluorescence intensity data of ADAM10 (k) and BACE1 (l) were recorded by confocal microscopy. All the data are reported as mean ± SEM of four independent experiments. *p < 0.05 and **p < 0.01 versus the control group; #p < 0.05 and ##p < 0.01 versus the indicated group