
Figure 6.
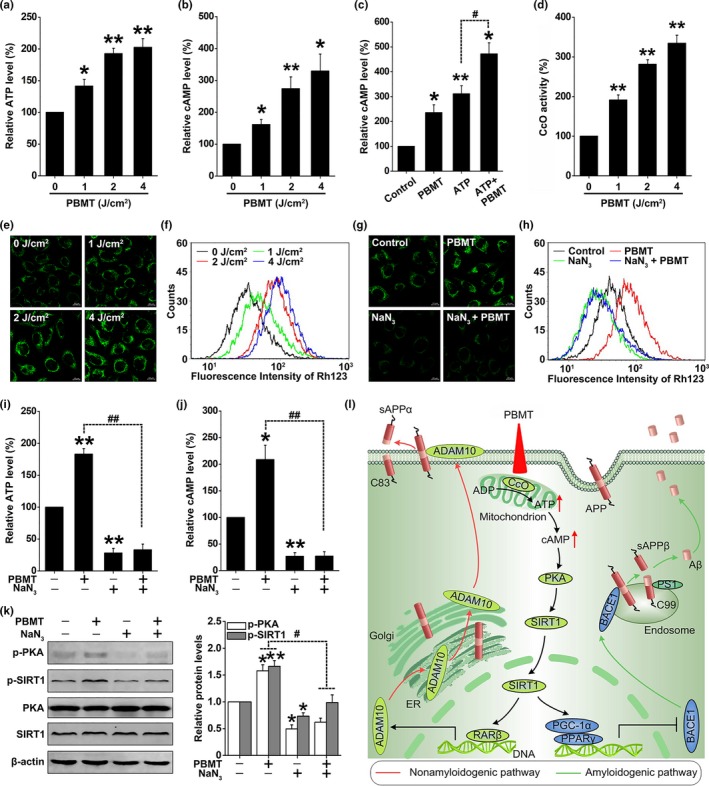
PBMT enhances mitochondrial photoacceptor CcO activity, increases ATP and cAMP levels, and further activates PKA/SIRT1 pathway in SH‐SY5Y‐APPswe cells. (a, b) SH‐SY5Y‐APPswe cells were treated with 0, 1, 2, and 4 J/cm2 PBMT. Relative ATP (a) and cAMP (b) levels were calculated as the percentage of the 0 J/cm2 dose level. (c) Relative cAMP content of SH‐SY5Y‐APPswe cells was determined after PBMT (2 J/cm2), with or without ATP (100 μM). (d) The measurement of CcO activity was determined in SH‐SY5Y‐APPswe cells under 0, 1, 2, and 4 J/cm2 PBMT. (e, f) The mitochondrial membrane potential (ΔΨmt) was detected by confocal microscopy (e) and flow cytometry (f) in Rhodamine 123 (Rh123) labeling SH‐SY5Y‐APPswe cells with indicated treatments. (g, h) ΔΨmt was detected by confocal microscopy (g) and flow cytometry (h) in Rh123 labeling SH‐SY5Y‐APPswe cells after treatment with NaN3 (10 mM). (i, j) SH‐SY5Y‐APPswe cells were treated with NaN3. Relative ATP (i) and cAMP (j) levels were calculated as the percentage of the control group level. (k) Western bolt analysis of p‐PKA and p‐SIRT1 levels after treatment with NaN3 in PBMT‐treated SH‐SY5Y‐APPswe cells. (l) Schematic representation of the signaling pathway for PBMT reducing Aβ levels by activating the PKA/SIRT1 signaling pathway. All the data are reported as mean ± SEM of four independent experiments. *p < 0.05 and **p < 0.01 versus the control group; #p < 0.05 and ##p < 0.01 versus the indicated group