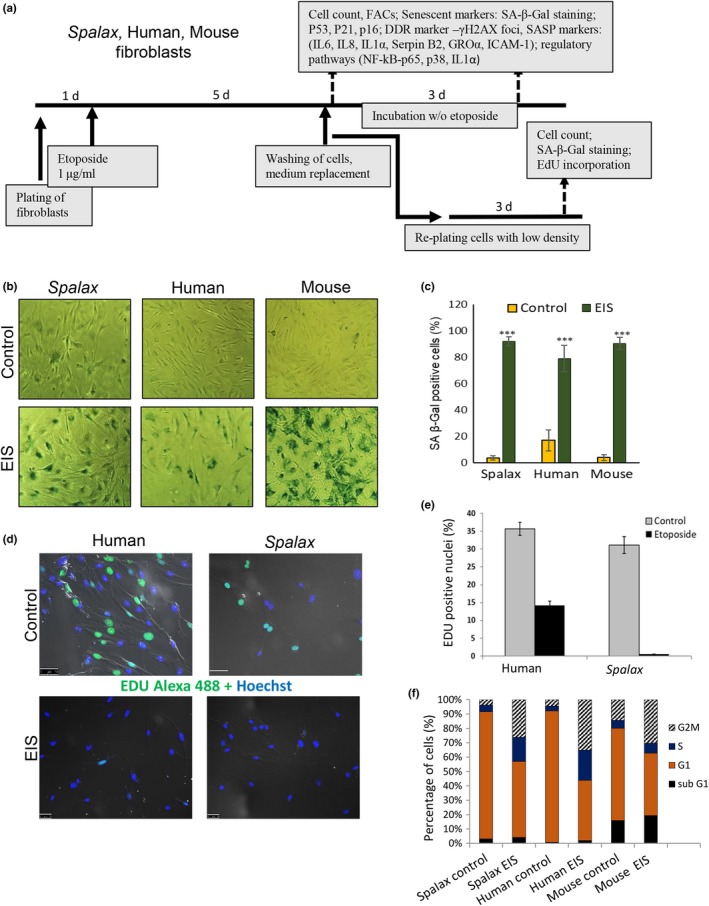
Figure 1.

Etoposide‐induced senescence (EIS). (a) Schematic illustration of the experimental design. (b) SA‐β‐Gal staining representative images. Fibroblasts were treated with DMSO (control) or with 1 μg/ml etoposide for 5 days, washed, and incubated for an additional 3 days without etoposide. (c) Percentage of SA‐β‐Gal‐positive cells calculated from at least 300 cells in four independent fields for each biological repeat (n = 3) in triplicate (Spalax and mouse cells were isolated from three independent individuals). The mean value of each species is compared to its control cells (DMSO‐treated), *** p < .001. (d) Representative fluorescence images demonstrating the levels of EdU incorporation in Spalax and human untreated and etoposide‐treated cells. (e) Quantitative data showing the % of EdU‐positive nuclei in untreated and etoposide‐treated Spalax and human fibroblasts. Experiments were repeated two times (n = 2) in triplicate. (f) Flow cytometry analysis showing the percentage of cells in cell cycle stages. Values represent the averages of at least two independent experiments in triplicate. EdU, 5‐ethynyl‐2‐deoxyuridine
