
Figure 2.
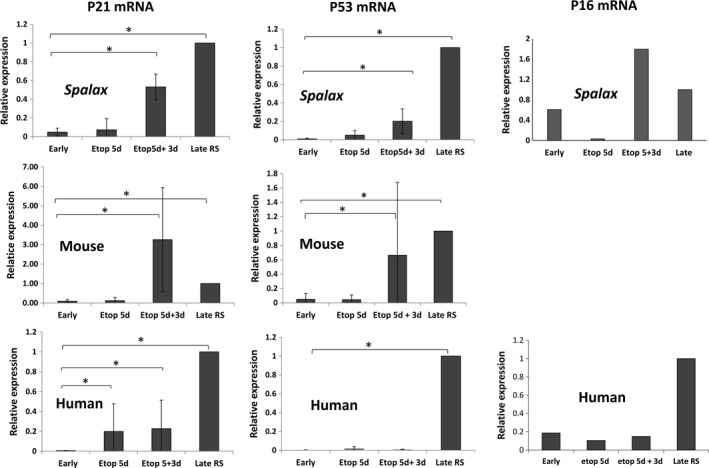
Expression of p21, p16, and p53 markers in senescent fibroblasts. The levels of mRNA expression were quantified in young cells (early‐passage fibroblasts) and senescent cells (late‐passage or etoposide‐treated fibroblasts) by using relative qRT–PCR; data of p21 and p53 mRNA levels are presented as mean ± SD of three independent experiments (n = 3, cells from three different individuals of Spalax and mice). * p < .05 depicts significant differences from early passage. p16 expression (representative data of two independent experiments are shown). RS, replicative senescence; Etop, etoposide