
Figure 4.
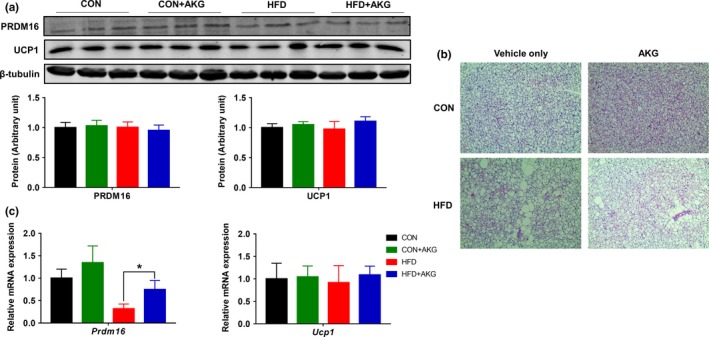
Effect of alpha‐ketoglutarate supplementation on metabolic activity of BAT. (a) PRDM16 and UCP1 contents in BAT analyzed by Western blot. (b) Representative H&E staining of BAT. (c) Prdm16 and Ucp1 mRNA levels in BAT analyzed by q‐PCR. *p < .05 (n = 6, mean ± SEM)