Figure 6.

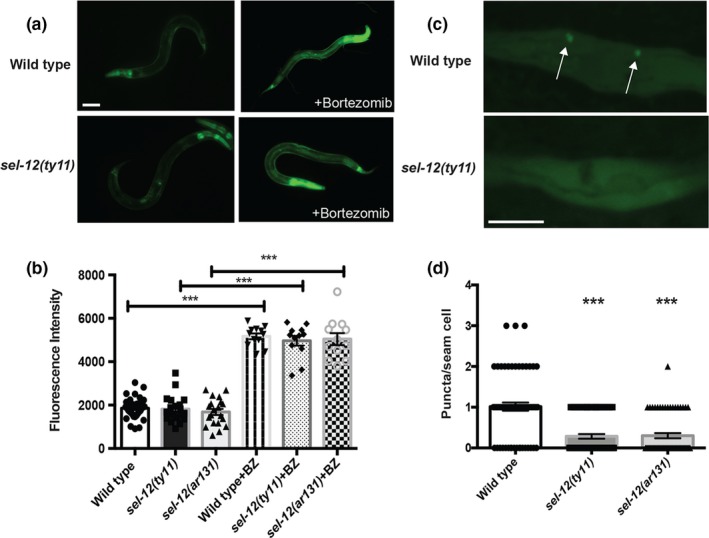
sel‐12 mutants show reduced autophagosome formation. (a) Representative images of wild‐type and sel‐12(ty11) animals expressing rpt‐3p::GFP (mgIs72) treated with proteasome inhibitor (bortezomib) for 24 hr at day 1 adulthood. Scale bar equals 100 μm. (b) Quantification of rpt‐3p::GFP intensity in wild‐type, sel‐12(ty11) and sel‐12(ar131) animals. (c) Representative images of wild‐type and sel‐12(ty11) animals expressing the autophagosome marker lgg‐1p::lgg‐1::GFP (adIs2122). The arrows indicate autophagosome formation (LGG‐1::GFP puncta). Scale bar equals 10 μm. (d) Quantification of LGG‐1::GFP puncta in wild‐type, sel‐12(ty11), and sel‐12(ar131) animals expressing lgg‐1p::lgg‐1::GFP (adIs2122) at day 1 of adulthood. Data are displayed as mean ± SEM, and all comparisons have been made to wild‐type animals or indicated strains. ns p > .05 and ***p < .001 were determined using one‐way ANOVA
