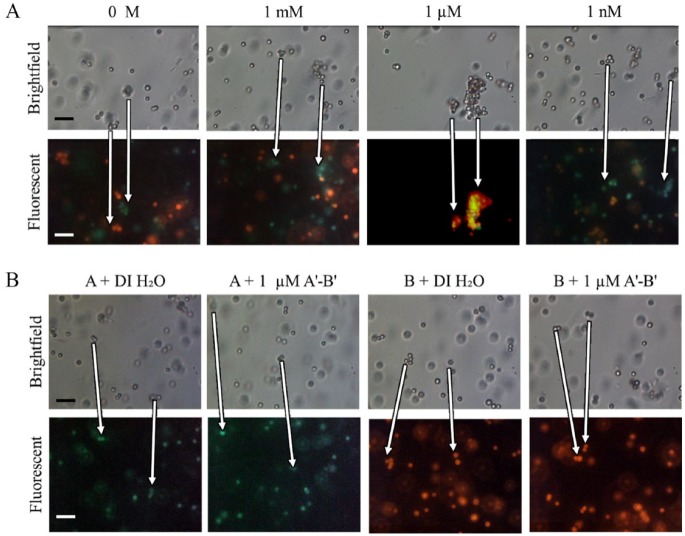
Figure 6.
Microsphere aggregate composition. (A) Brightfield and composite fluorescent images of 1 µm red and green microspheres mixed with 1 mM, 1 µM, 1 nM, and 0 M A′-B′ after 60 min of incubation. (B) Brightfield and fluorescent images of single-color microspheres mixed with either 1 µM A′-B′ or DI H2O after 60 min of incubation. Scale bars are 5 µm. Arrows indicate the movement of individual aggregates during the time interval between the brightfield and fluorescent images.

