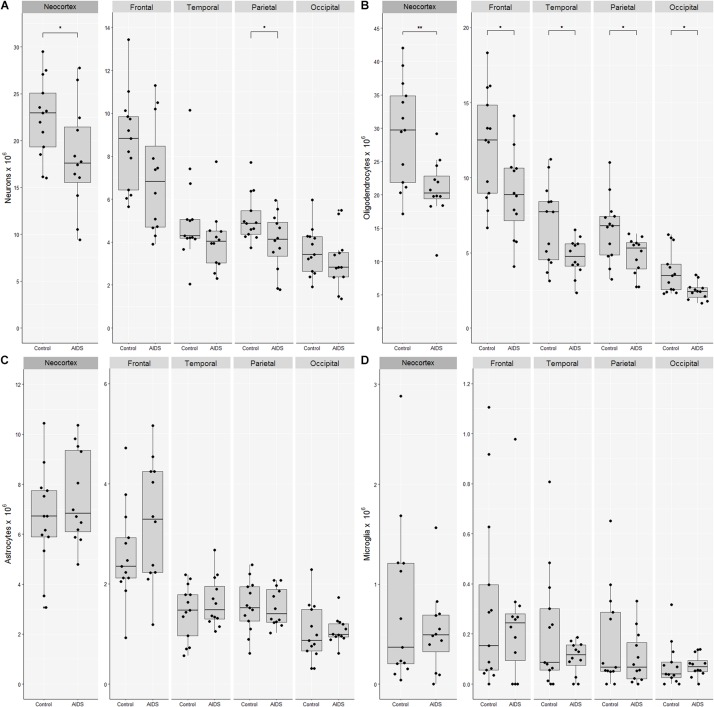
FIGURE 2.
Loss of neocortical neurons and oligodendrocytes in AIDS patients. Combined boxplots and strip-charts showing the stereological cell estimates for (A) neurons, (B) oligodendrocytes, (C) astrocytes, and (D) microglia in controls and AIDS patients, for entire neocortex, and frontal, temporal, parietal, and occipital cortices. The boxes show the mean and the 25–75th percentile range, and whiskers the range of data within 1.5 of the interquartile range. Each point represents an estimate from an individual brain. ∗p < 0.05, ∗∗p < 0.01.

