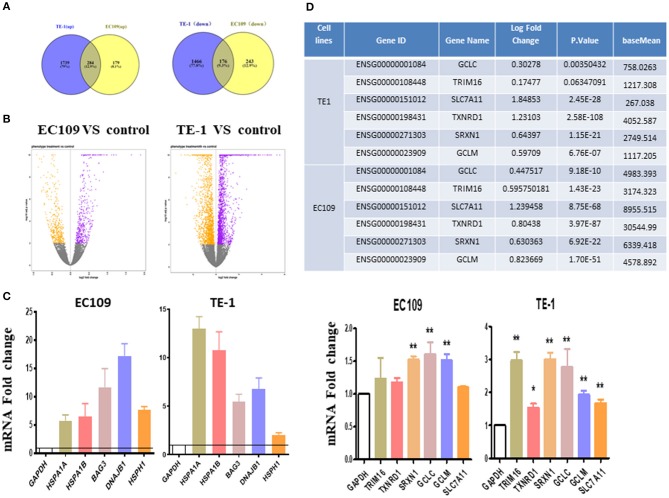
Figure 2.
Transcriptome changes induced by oridonin using RNA-seq. (A) Venn diagram showing amounts of differentially expressed genes after treatment with oridonin for 4 h in EC109 cells and TE1 cells. (≥two-fold up/down-regulated, P < 0.01). (B) The “volcano plot” graph of the differentially expressed genes in EC109 and TE1 cells. (C) Verify RNAseq by qPCR analysis. TRIM16, TXNRD1, SRXN1, SLC7A11, GCLC, or GCLM and HSPA1A, HSPA1B, BAG3, DNAJB1, HSPH1 in EC109 cells and TE1 cells, respectively. Cells were treated with 30 μM oridonin or DMSO for 4 h. (D) Differentially expressed genes related to GSH in RNAseq. *P < 0.05, **P < 0.01 compared to DMSO group.

