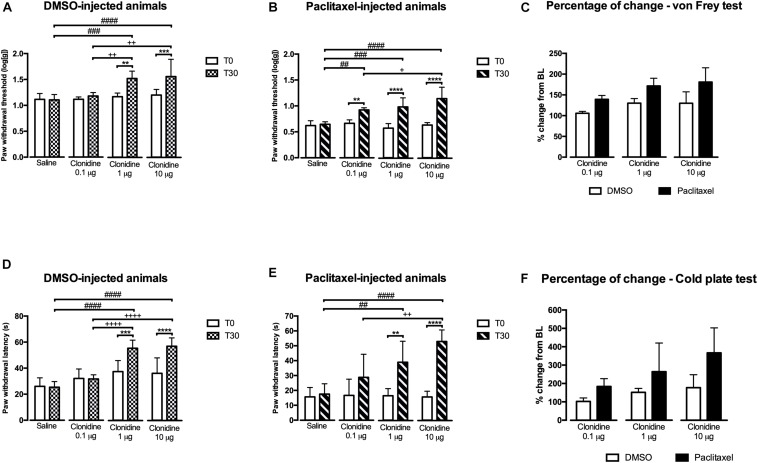
FIGURE 3.
Nociceptive behavioral effects of the administration of clonidine (30 days after the first paclitaxel injection). (A,B) Show paw withdrawal thresholds in the von Frey test at baseline (T0) and 30 min (T30) after saline or clonidine administration. (D,E) Show paw withdrawal latencies in the cold plate test at T0 and T30 after saline or clonidine administration. (C,F) Show the percentage of change from baseline of paw withdrawal thresholds and latencies, in the von Frey (C) and cold plate (D) tests. Data are presented as mean ± SD (saline: DMSO n = 7; paclitaxel n = 6; clonidine at 0.1 μg: DMSO n = 6; paclitaxel n = 7; clonidine at 1 μg: DMSO n = 7; paclitaxel n = 7; clonidine at 10 μg: DMSO n = 8; paclitaxel n = 6). ∗∗p < 0.01; ∗∗∗p < 0.001; ****p < 0.0001 vs. baseline (T0); ##p < 0.01; ###p < 0.001; ####p < 0.0001 vs. saline. +p < 0.05; ++p < 0.01; ++++p < 0.0001 vs. clonidine 0.1 μg.

