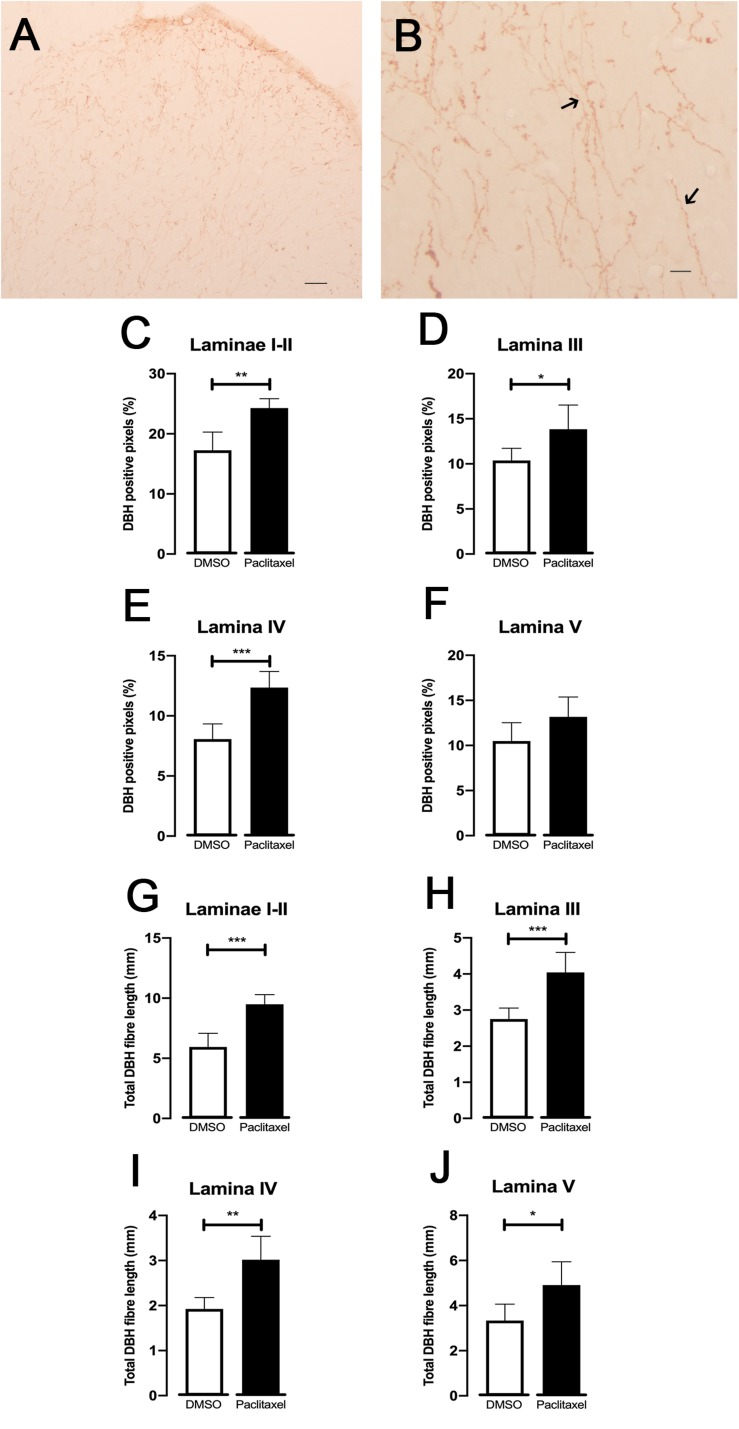
FIGURE 4.
Spinal noradrenergic system evaluated by DBH immunoreaction (30 days after the first paclitaxel injection). Representative photomicrographs of DBH expression at the spinal dorsal horn (A,B). The details of fibers namely varicosities are better depicted in (B) (arrows). Scale bar in (A,B) 200 and 25 μm, respectively. The mean percentages of DBH positive pixels evaluated using the ROI manager are shown in laminae I-II (C), III (D), IV (E), and V (F). The total length of DBH-immunoreactive fibers quantified using skeleton macro is shown in laminae I-II (G), III (H), IV (I), and V (J). Data are presented as mean ± SD (DMSO n = 6; paclitaxel n = 6). ∗p < 0.05; ∗∗p < 0.01; ∗∗∗p < 0.001 paclitaxel vs. DMSO.

