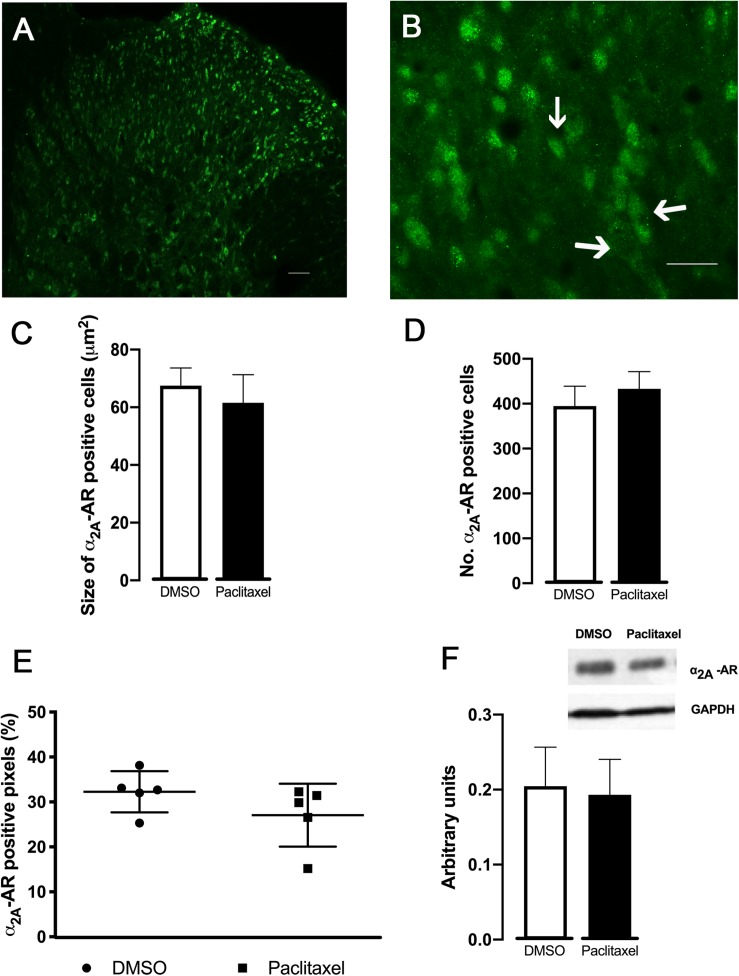
FIGURE 5.
Expression of α2A-AR in the spinal dorsal horn (30 days after the first paclitaxel injection). Representative photomicrographs of a α2A-AR positive pixels at laminae I–II are shown in (A,B). The immunolabelling occurs in structures with neuronal morphology, which are better represented by arrows in (B). Scale bar in (A,B): 100 and 50 μm, respectively. (C,D) Show the size and the number of α2A-AR positive neurons, respectively, determined in laminae I-II in DMSO- and paclitaxel-injected animals. (E) Represents the percentage of α2A-AR positive pixels in laminae I-II of DMSO- and paclitaxel-injected animals. Data are presented as mean ± SD (DMSO n = 5; paclitaxel n = 5). (F) Depicts the quantification of α2A–AR assessed by western-blotting from DMSO- and paclitaxel-injected animals. GAPDH was used as a control of the western-blotting procedure. Data are presented as mean ± SD (DMSO n = 5; paclitaxel n = 5).

