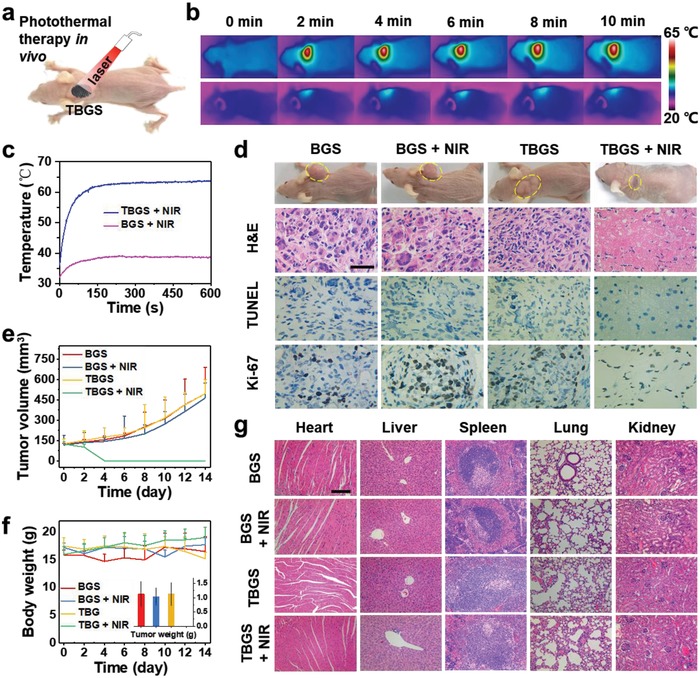
Figure 4.

In vivo photothermal‐performance evaluation of TBGSs. a) Schematic illustration of TBGSs for in vivo photothermal cancer ablation. b) The corresponding IR thermal images at tumor sites of Saos‐2 tumor‐bearing mice in groups of BGS + laser (upper) and TBGS + laser (bottom). c) Temperature elevations at tumor sites of Saos‐2 tumor‐bearing mice in groups of BGS + laser and TBGS + laser. d) Photographs of Saos‐2 tumor‐bearing mice on 14th day after different treatments, and the tumor tissues stained by H&E, TUNEL (apoptosis), and Ki‐67 (proliferation) in 1 day after different treatments (scale bars: 10 µm). e) Time‐dependent tumor‐growth curves (n = 5, mean ± s.d.) after different treatments. f) Time‐dependent body‐weight curves of mice after different treatments. Inset: tumor weights of mice on the 14th day after varied treatments. n = 5. g) H&E staining of major organs (heart, liver, spleen, lung, and kidney) of Saos‐2 tumor‐bearing mice on the 14th day after different treatments (scale bars: 100 µm).
