
Figure 7.
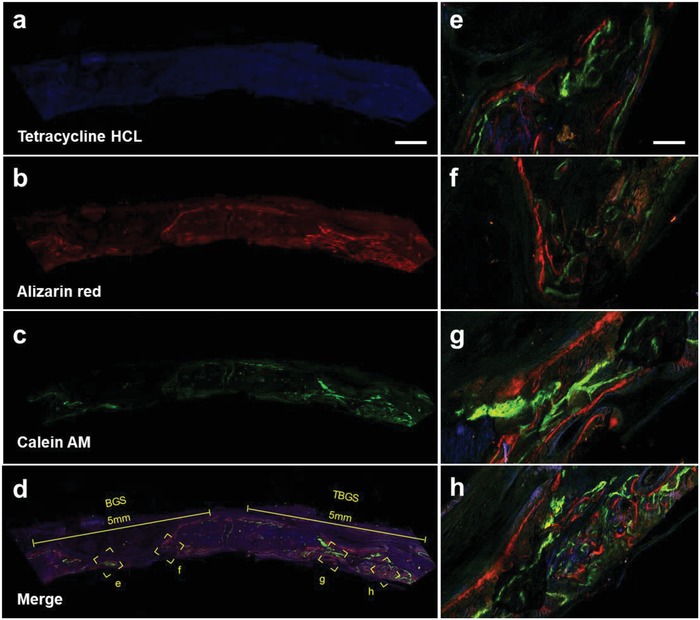
Confocal fluorescence images for superficial analysis of newborn osseous tissue of BGS and TBGS groups at week 8. a) Tetracycline HCL (blue fluorescence) injected intramuscularly into calvarial defect model rats at week 2. b) Alizarin red (red fluorescence) injected intramuscularly into calvarial defect model rats at week 4. c) Calcein‐AM (green fluorescence) injected intramuscularly into calvarial defect model rats at week 6. d) Merged image of three fluorochromes. These three fluorochromes represent newborn osseous tissue in different therapeutic duration. Scale bar in (a)–(d) is 1 mm. e,f) Magnified images represented newborn bone around BGS. g,h) Higher‐magnification images indicating the hierarchical architecture of bone around TBGS and its corresponding material‐guided regeneration process. Scale bar in images (e)–(h) is 125 µm.