
Figure 8.
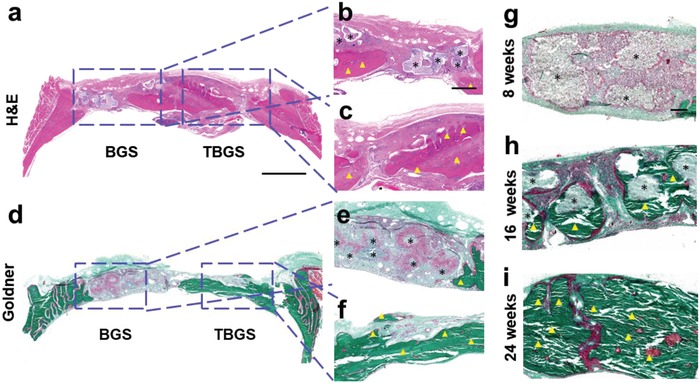
Histology staining of harvested craniums of Sprague–Dawley rats implanted with BGS/TBGS at week 24. a–c) H&E staining of harvested craniums obtained from SD rats at week 24 after operation. d–f) Goldner staining of harvested craniums of SD rats at week 24 after implanting with BGS and TBGS. g–i) Goldner staining of TBGS group at different period of weeks 8, 16, and 24. The defect areas were implanted with BGS and TBGS. Black asterisks mark implanted scaffolds that were not biodegraded completely. Yellow triangles indicate newborn osseous tissue. Scale bar in (a) and (d) is 2 mm. Scale bar in (b), (c), (e), and (f) is 500 µm. Scale bar in (g)–(i) is 200 µm.