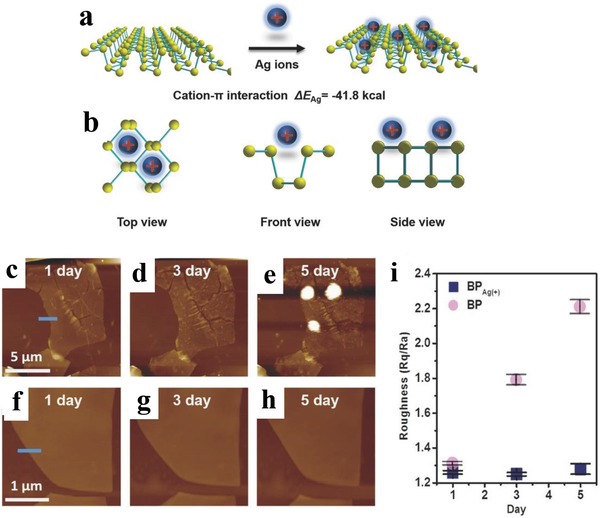
Figure 19.

a) Schematic representation of adsorption of Ag+ on BPNSs. b) Three different views of the Ag+‐modified BPNSs. AFM images of c–e) the bare BPNSs and f–h) the Ag+‐modified BPNSs exposed to air for 1–5 d. i) Changes in the surface roughness before and after functionalization with exposure time. Reproduced with permission.194 Copyright 2017, John Wiley and Sons.
