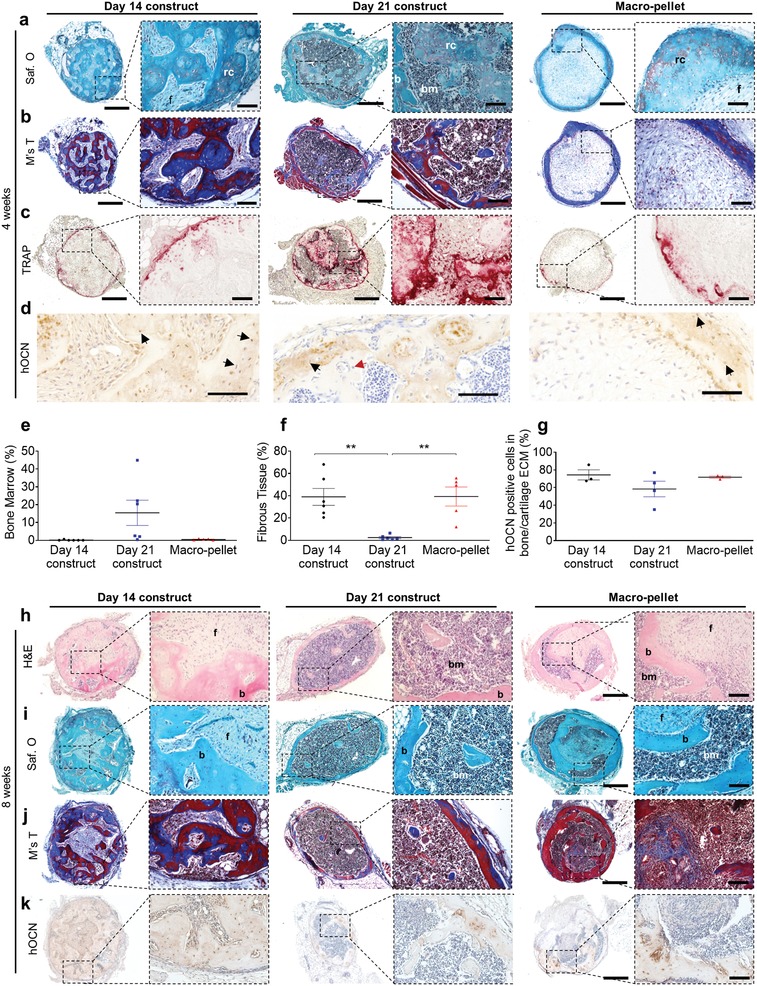
Figure 4.

Histological assessment after ectopic implantation. a) Safranin O, b) Masson's Trichrome, c) TRAP, and d) hOCN staining of day14, day 21 constructs, and Macropellet 4 weeks after in vivo implantation. e–g) Quantification (mean value ± SEM) of: e) bone marrow compartment (n = 5–6), f) fibrous tissue area (n = 5–6), and g) hOCN positive cells (n = 3–4) 4 weeks after implantation. h) Hematoxylin and eosin (H&E), i) Safranin O, j) Masson's Trichrome (M's T), and k) hOCN staining after 8 weeks in vivo implantation. *p < 0.05; **p < 0.01; ***p < 0.001; one‐way ANOVA followed by Tukey's multiple comparison test. Scale bars: a–c,h–j) 500 µm (left) and 100 µm (right) and d) 100 µm.
