
Figure 1.
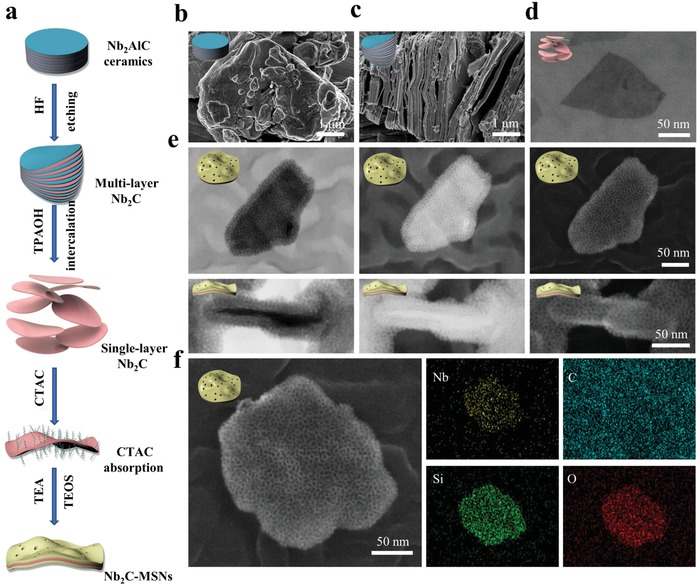
Synthesis and characterization of Nb2C–MSNs composite nanosheets. a) Schematic illustration showing the synthetic process of Nb2C–MSNs composite nanosheets. b–d) SEM images of: b) Nb2AlC ceramics, c) multilayer Nb2C after HF etching, and d) single‐layer Nb2C nanosheets after TPAOH intercalation. e) Bright‐field TEM (left), dark‐field TEM (middle), and SEM (right) images of Nb2C–MSNs (vertical (down) and lateral (upper) views, scale bar: 50 nm). f) SEM image and corresponding elemental mapping of Nb2C–MSNs composite nanosheets (Nb, C, Si, and O; scale bar: 50 nm).