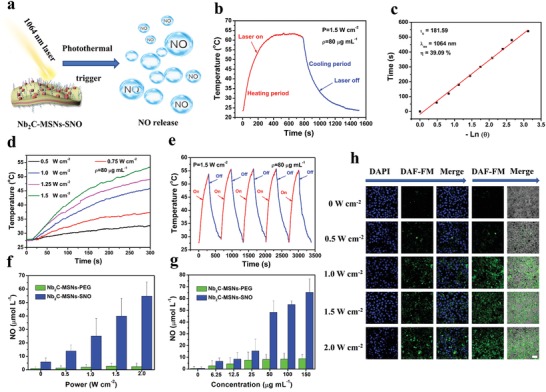
Figure 3.

In vitro photothermal‐conversion performance and photothermal‐triggered NO release from Nb2C–MSNs–SNO composite nanosheets. a) Schematic illustration of NO release from Nb2C–MSNs–SNO under NIR‐II (1064 nm) laser irradiation. b) Photothermal profile of Nb2C–MSNs–SNO composite nanosheets dispersed suspension ([Nb] = 80 mg mL−1) under NIR‐II laser irradiation at 1.5 W cm−2 until reaching the steady‐state temperature and a cooling period after the laser was shut off. c) Time constant for heat transfer from the system by using the linear time data from the cooling period versus. d) Photothermal‐heating curves of Nb2C–MSNs–SNO at elevated power densities under 1064 nm laser irradiation ([Nb] = 80 µg mL−1). e) Recycling heating curves of Nb2C–MSNs–SNO suspension dispersed in deionized water with 1064 nm laser irradiation for five laser on/off cycles ([Nb] = 80 µg mL−1, 1.5 W cm−2). f,g) Quantitative assessment of NO release from Nb2C–MSNs–SNO and Nb2C–MSNs–PEG under varied treatments including: f) different power densities (0, 0.5, 1.0, 1.5, and 2.0 W cm−1, [Nb] = 50 µg mL−1) and g) varied concentrations (1.5 W cm−2, [Nb] = 0, 6.25, 12.5, 25, 50, 100, and 150 µg mL−1). h) Intracellular detection of NO release in 4T1 cancer cells after the coincubation with Nb2C–MSNs–SNO followed by laser irradiation at different power densities (0, 0.5, 1.0, 1.5, and 2.0 W cm−2, [Nb] = 50 µg mL−1; scale bar: 50 µm).
