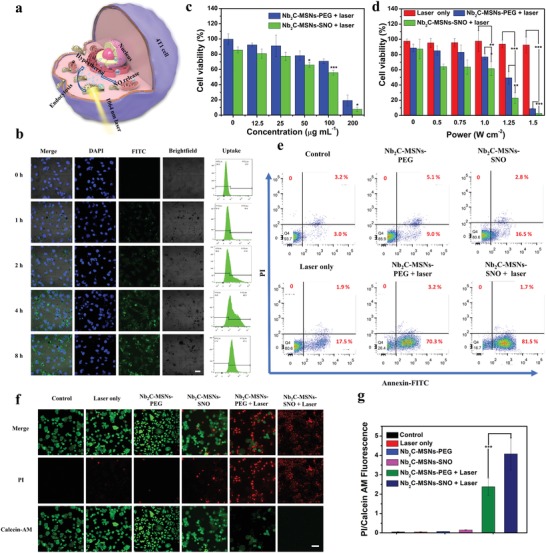
Figure 4.

In vitro synergistic thermogaseous therapy. a) Schematic illustration of synergistic thermogaseous therapy against 4T1 cancer cells enabled by Nb2C–MSNs–SNO at the cell level. b) CLSM imaging and flow cytometry analysis of 4T1 cells incubated with FITC‐labeled Nb2C–MSNs–SNO for 0, 1, 2, 4, and 8 h. Scale bar: 20 µm. c,d) Cytotoxicity of Nb2C–MSNs–SNO and Nb2C–MSNs–PEG to 4T1 cells under different treatments including: c) different concentrations ([Nb] = 0, 12.5, 25, 50, 100, and 200 µg mL−1) and d) different power densities (0, 0.5, 0.75, 1.0, 1.25, and 1.5 W cm−2). (P‐values: * < 0.05, ** < 0.01, *** < 0.001). e) Flow cytometry quantification assay on relative viabilities of 4T1 cell after different treatments (PBS, Nb2C–MSNs–PEG, Nb2C–MSNs–SNO, 1064 nm laser only, Nb2C–MSNs–PEG + 1064 nm laser, and Nb2C–MSNs–SNO + 1064 nm laser). f) CLSM images of 4T1 cells stained by calcein AM (green) and PI (red) after different treatments. Scale bar: 50 µm. g) The ratio of PI/calcein AM of 4T1 cells after different treatments. (P‐values: * < 0.05, ** < 0.01, and *** < 0.001).
