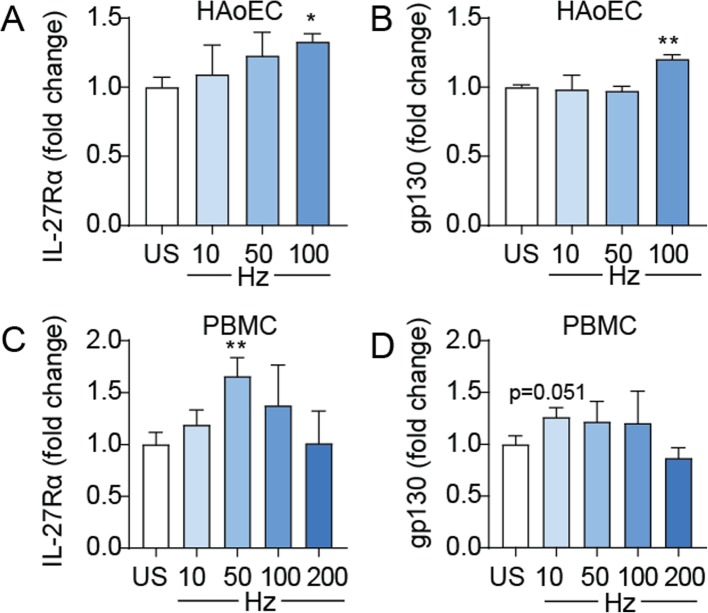
Fig. 5.
Effects of hemozoin on IL-27Rα and gp130 gene expression in HAoEC and PBMC. The cells were incubated with different concentrations of hemozoin (Hz) ranging from 10 to 200 μg/mL (indicated as Hz10, Hz50, Hz100 and Hz200) for five (a) and 22 (b-d) hours. Gene expression analyses were done by qPCR, related to reference gene β-actin/TaqMan reference probes and normalized to unstimulated cells (US). The figure shows mRNA levels of IL-27Rα and gp130 in HAoEC (a and b) and in PBMC (c and d). Results are representatives of minimum three experiments and data are presented as mean and SEM. *p < 0.05 and **p < 0.01 versus unstimulated cells (white bar)

