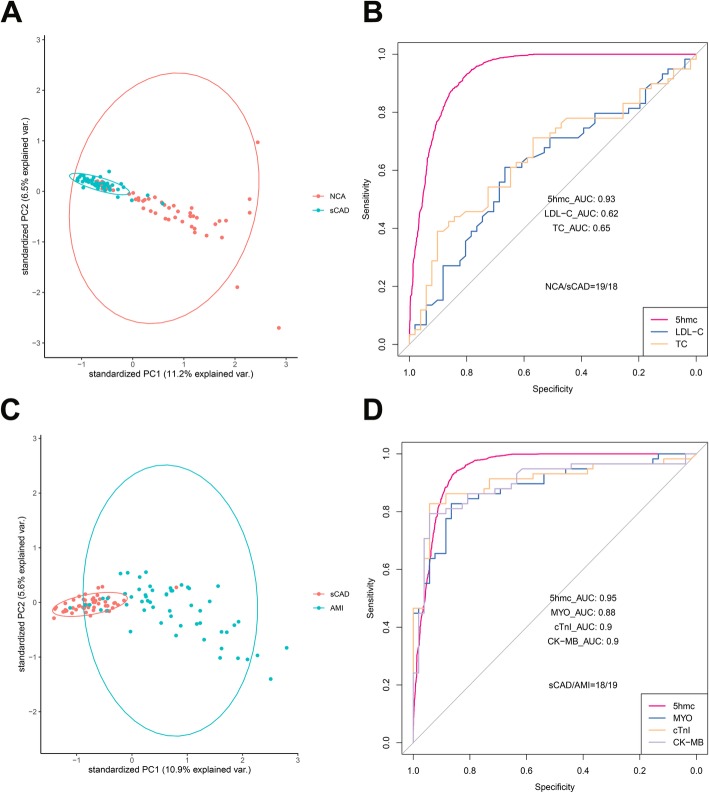
Fig. 3.
Performance of potential 5hmC markers for diagnosis and prediction of stable coronary artery disease and acute myocardial infarction. a Principle component analysis (PCA) plot of 5hmC FPKM in cfDNA from sCAD and NCA samples. b Receiver operating characteristic (ROC) curve of the classification model with potential 5hmC markers and clinical indicators, including TC and LDL-C in the validating set (18 sCAD patients vs. 19 NCA individuals). The true positive rate (sensitivity) is plotted in function of the false positive rate (specificity). c Principle component analysis (PCA) plot of 5hmC FPKM in cfDNA from AMI and sCAD samples. d Receiver operating characteristic (ROC) curve of the classification model with potential 5hmC markers and clinical indicators, including cTnI, MYO and CK-MB in the validating set (19 AMI patients vs. 18 sCAD patients). The true positive rate (sensitivity) is plotted in function of the false positive rate (specificity). NCA normal coronary artery, sCAD stable coronary artery disease, AMI acute myocardial infarction, FPKM fragments per kilobase of transcript per million mapped reads, AUC area under the curve, TC total cholesterol, LDL-C low-density lipoprotein cholesterol, cTnI cardiac troponin I, MYO myoglobin, CK-MB MB isoenzyme of creatine kinase

