Graph 6.

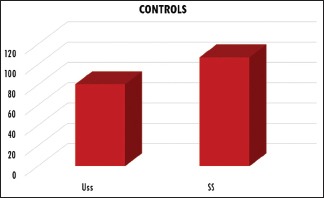
Comparison of unstimulated and stimulated salivary flow rate in the control group. Uss: Unstimulated saliva, SS: Stimulated saliva

Comparison of unstimulated and stimulated salivary flow rate in the control group. Uss: Unstimulated saliva, SS: Stimulated saliva