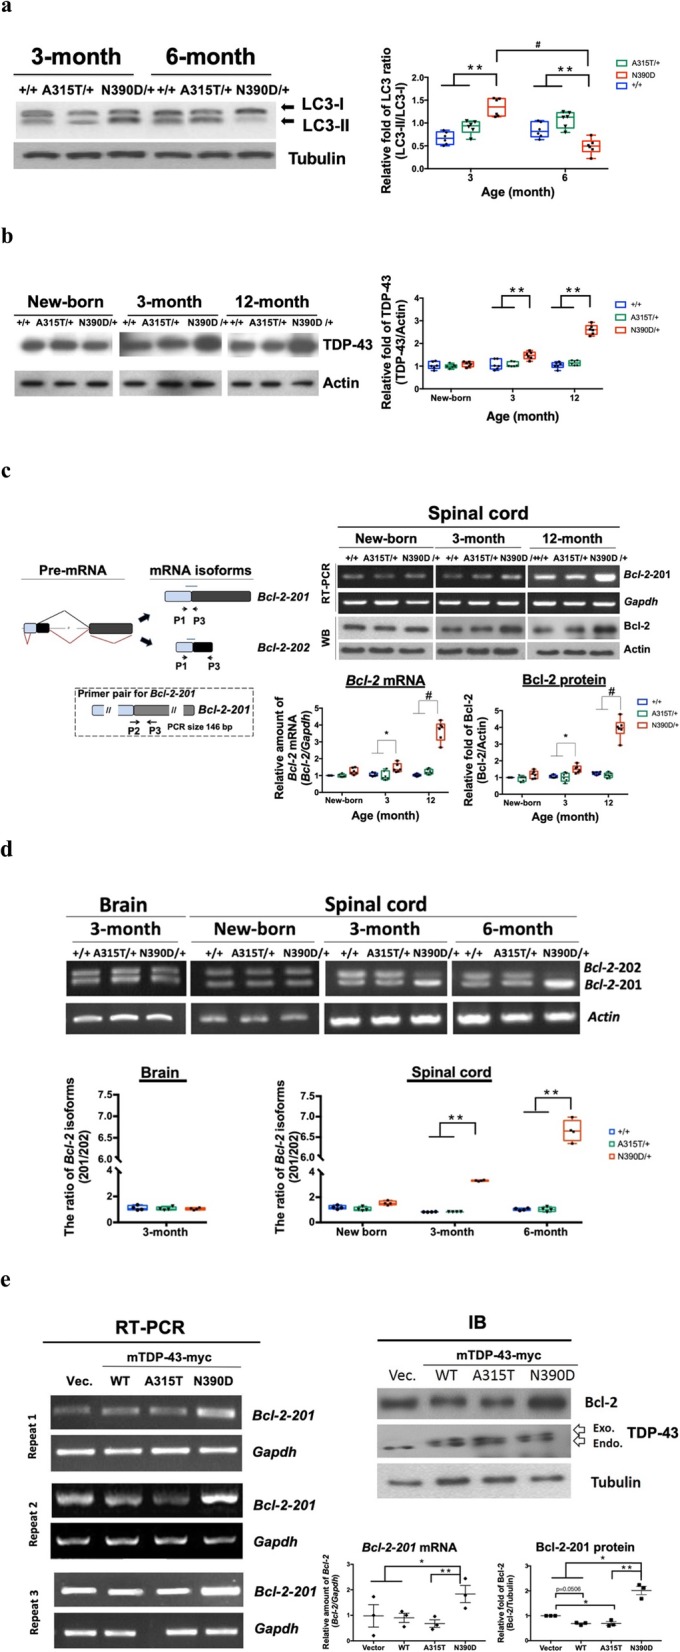
Fig. 4.

Effects of TDP-43 (N390D) mutation on autophagy and Bcl-2 expression. a-b Expression of LC3-I and LC3-II (a) and TDP-43 protein (b) in the spinal cord of +/+, A315T/+ and N390D/+ male mice at different ages. The blots are exemplified on the left, and the statistical analyses are shown on the right box plot (min to max with all points). c The left scheme is the alternative splicing of Bcl-2 pre-mRNA to generate the Bcl-2-201 mRNA (the black lines) and Bcl-2-202 mRNA (the red lines). The 3 arrows (P1, P2 and P3) indicate the primers used for RT-PCR. Blue lines indicate location of the coding region. The boxes with different colors are the different exons. The arrows in the dashed frame are the primers (P2, P3) used for detecting the Bcl-2-201 mRNA. The expression of Bcl-2-201 mRNA and Bcl-2 protein in the spinal cords of A315T/+, N390D/+ and +/+ male mice at different ages are exemplified in the upper right two panels, with the statistical analysis of the levels of Bcl-2 mRNA and Bcl-2 protein shown in the lower right two box plots (min to max with all points). d The changes of the relative ratio of the two Bcl-2 mRNA isoforms. N = 4 (2 from each of the two independent lines) per group. e Comparison of the levels of Bcl-2 expression in transfected N2a cells. The levels of Bcl-2-201 mRNA and Bcl-2 protein were assayed by RT-PCR (left panels) and by Western blotting (right upper panel), respectively. The statistical analysis of the levels of Bcl-2 mRNA and Bcl-2 protein are in the right lower 2 dot plots (mean ± SD). N = 6 (3 from each of the two independent lines) per group in a and c. Significantly different represented in a-e: *p < 0.05, **p < 0.01, #p < 0.001
