Fig. 2.
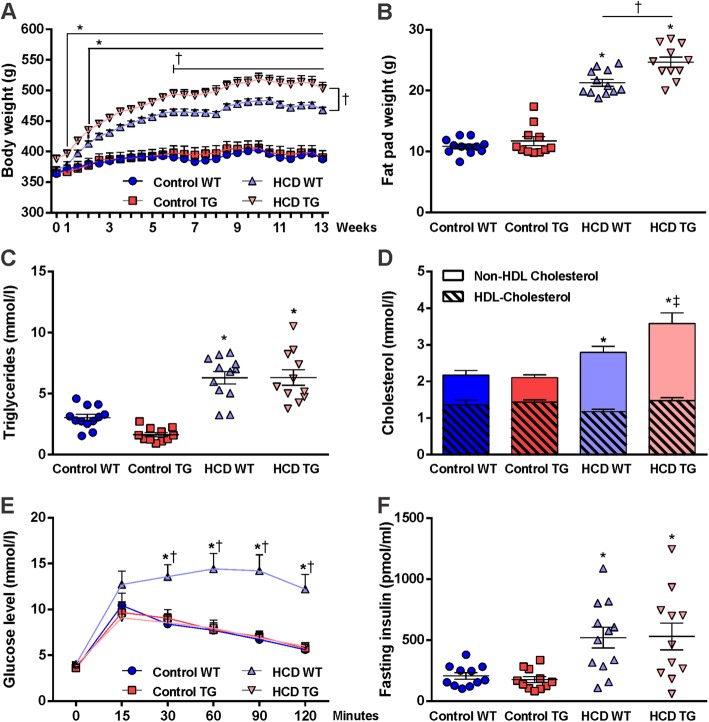
Weight gain, visceral fat accumulation, lipid, and glucose metabolism. a Body weight change over the course of the diets. b Post-mortem paired epididymal fat pad weight. c Fasting triglyceride levels measured at the end of week 12 on the diets. b Fasting levels of total cholesterol presented as the whole bar and its fractions: Non-HDL (upper part of a bar) and HDL-Cholesterol (lower part of a bar). e Blood glucose levels during 2-h intraperitoneal glucose tolerance test (IGTT) after 11 weeks on the diets. Zero time point (0) represents fasting glucose value obtained immediately before glucose load. f Fasting insulin levels measured from a blood sample drawn at time point 0 during IGTT. Animal numbers are as follows: control WT (n = 12), control TG (n = 11), HCD WT (n = 12), HCD TG (n = 11). Values are presented as mean ± SEM. Significance is indicated by * between HCD and both control groups (in d—for non-HDL cholesterol), † between HCD groups, and ‡ between HCD TG and both control groups for total cholesterol. RM two-way ANOVA and one-way ANOVA, Tukey’s multiple comparisons test, p < 0.05. HCD hypercaloric diet, HDL high-density lipoprotein, TG transgenic, WT wildtype

