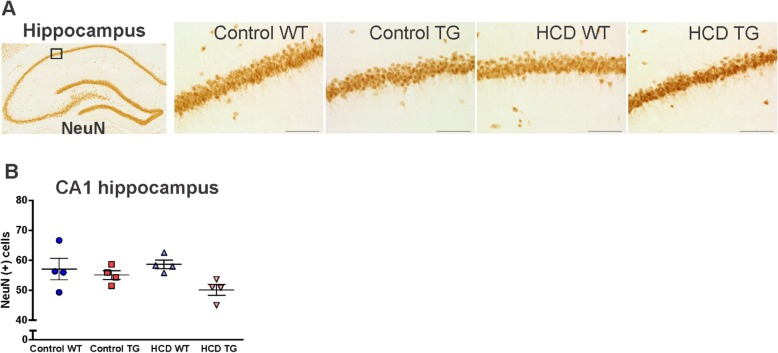
Fig. 7.
Neuronal counts identified by neuronal nuclear antigen (NeuN) immunohistochemistry. a 20× photomicrographs of the dorsal hippocampus CA1 subregion pyramidal neurons. Scale bar 100 μm. Boxed area corresponds to a field defined for cell counts. b NeuN-positive cell counts in a field of area 0.2 mm2. Animal numbers are n = 4 in each group. Values are presented as mean ± SEM. HCD hypercaloric diet, TG transgenic, WT wildtype. One-way ANOVA, Tukey’s multiple comparisons test, p < 0.05

