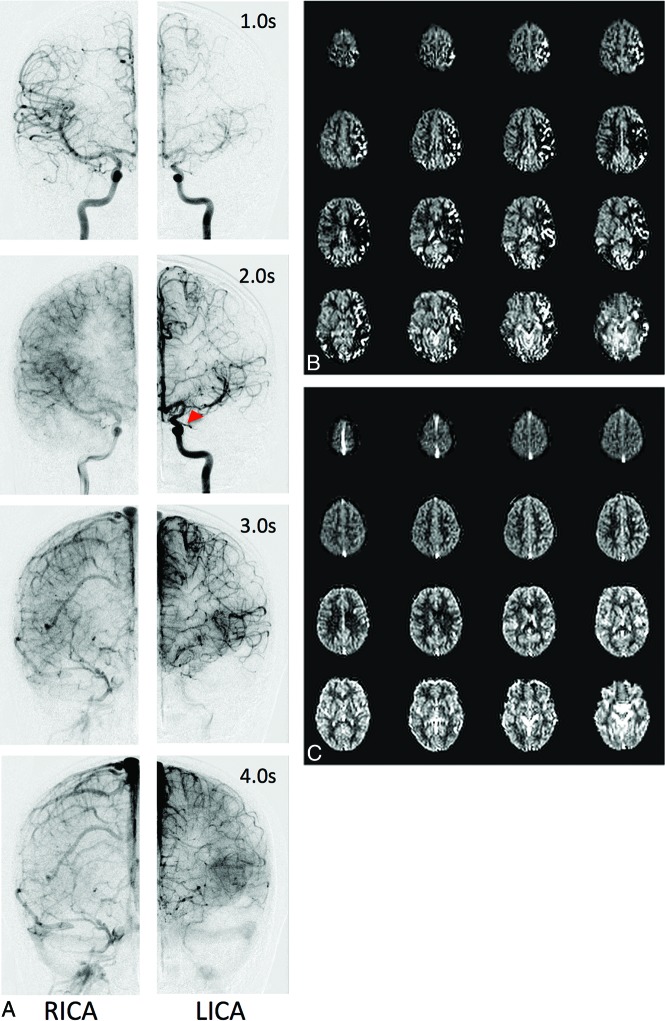
Fig 2.
Representative DSA data (A), PASL CBF maps (B), and VSASL CBF maps (C) for a preoperative patient with left-sided moyamoya. A, Frontal DSA data from bilateral ICA injections at various postinjection times. The right side appears relatively normal, with early arterial filling and ACA/MCA parenchymal blush at 2.0 seconds. In contrast, the left side demonstrates delayed anterograde filling through a proximal M1 MCA stenosis (red arrowhead), retrograde filling via ACA-MCA collaterals, and delayed parenchymal perfusion of the MCA territory. Parenchymal perfusion of the left MCA territory is finally reached by 4.0 seconds. PASL maps (B) reflect the DSA appearance at 2.0 seconds bilaterally, including areas of curvilinear hyperintensity corresponding to macrovascular flow and perfusion deficit, while VSASL maps (C) reflect parenchymal DSA phases, despite these occurring at different times (2.0 seconds on the right, 4.0 seconds on the left). RICA indicates right ICA injection; LICA, left ICA injection.

